

BITCOIN CHARTS AND INDICATORS
What is happening with Bitcoin?
Twelve sections, one card each, with the latest reading where the section has one. The 92 indicator pages sit inside the seven categories, and the 36 technical indicators have a section of their own.
Every Bitcoin section
Price
$83.6Klatest priceWhat is the Bitcoin price in dollars?
Daily closeLive priceOpen the chart ↗The price itself↗Record high
34%below peakHow far is Bitcoin from its high?
Below the recordLatest readingReading for Open the chart ↗The price itself↗Returns
Up 6.2%so far in SeptemberHow has Bitcoin performed month by month?
Rising monthFalling monthReading for Open the chart ↗A score out of 100↗Cycle Stage
32Early Recovery, out of 100Where is Bitcoin in its market cycle?
Cycle score, 0 to 100Latest readingReading for Open the section ↗A score out of 100↗Cheap or Expensive
41Fairly Priced, out of 100Is Bitcoin cheap or expensive?
Cheap or expensive score, 0 to 100Latest readingReading for Open the section ↗A score out of 100↗Who Owns the Coins
64Buying, out of 100Are people buying or selling Bitcoin?
Buying and selling score, 0 to 100Latest readingReading for Open the section ↗A score out of 100↗Network & Mining
59Steady, out of 100How strong is Bitcoin's network right now?
Network health score, 0 to 100Latest readingReading for Open the section ↗A score out of 100↗Fear & Greed
55Neutral, out of 100What mood is Bitcoin in?
Crowd mood, 0 to 100Latest readingReading for Open the section ↗Read off the price chart↗Price & Trend
Above 3 of 4long-run averagesWhere does the price sit against its trend?
Price ÷ 200-day average200-day averageReading for Open the section ↗Read off the price chart↗Technical indicators
77Rising, out of 100What is the Bitcoin market telling you?
Daily close, past yearReading for Open the section ↗Read off the price chart↗Key Levels
$64.8Kthickest wall belowWhere are Bitcoin's floors and ceilings?
Bitcoin priceMiddle buy priceReading for Open the section ↗The wider economy↗Cross Markets
How does Bitcoin compare with the wider economy?
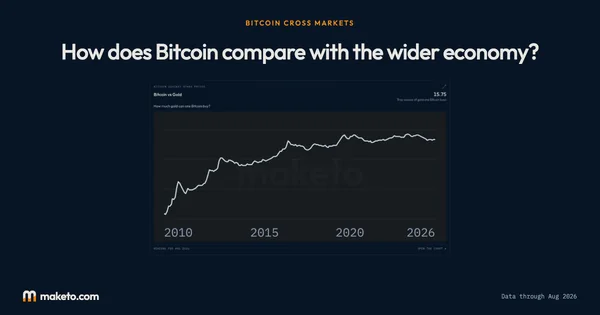 Open the section ↗
Each card shows its section's lead reading and the shape of its record, where the section has one. Open a card to see every chart inside it.
RIGHT NOW
Bitcoin’s latest daily close is $83,462.70 as of 28 Sep 2026.
The latest close, $83,463 on 28 Sep 2026, is 33.88% below the all-time high and 37.6% of the way back from the low since then.
What do the five daily scores say?
As of 28 Sep 2026, the cycle-position score reads early recovery at 32 out of 100, the cheap or expensive score reads fairly priced at 41, the buying and selling score reads buying at 64, the network health score reads steady at 59 and the Fear and Greed Index reads neutral at 55.
Each score is built from its own measures and answers its own question, so they sit side by side and are never averaged.
What does the price chart say?
Bitcoin's price sits above 3 of its 4 long-run averages, as of 28 Sep 2026. The technical indicators' combined reading is rising, at 77 out of 100, as of 28 Sep 2026.
Where People Bought marks the band on each side where owners are packed most tightly. Below: $63,607 to $66,041, 22.3% under the price. Above: $84,294 to $88,256, 3.4% over the price. Owners counted on , measured from the close on , $83,463.
What can't these readings tell you?
Every card describes what has already happened, up to its own latest reading. None is a forecast, and none is advice to buy or sell.
Understanding
Bitcoin Charts and Indicators
Where it stands today
Bitcoin’s latest daily close is $83,462.70 as of .
Bitcoin's cycle-position score is 32 out of 100, which reads early recovery as of .
Bitcoin's cheap / expensive score is 41 out of 100, which reads fairly priced as of .
Bitcoin's buying and selling score is 64 out of 100, which reads buying as of .
Bitcoin's network health score is 59 out of 100, which reads steady as of .
The Bitcoin Fear and Greed Index is 55 out of 100, a neutral reading as of .
Bitcoin's price sits above 3 of its 4 long-run averages as of .
Combined: rising, at 77 out of 100 as of .
What is on this page?
One card for each section of Maketo's Bitcoin pages: the price itself, the five daily scores out of 100, the readings taken off the price chart, and Bitcoin beside the wider economy. Each card shows the reading its section leads with, the day that reading is for and a small picture of its record. The Cross Markets card is the exception: it opens its section without a figure. Open a card for every chart inside it.
Where is the full list of indicators?
Inside the seven category cards. Each category page links every indicator in it, and search, at the top of every page, finds any of them by name. The technical indicators have a section of their own. Price & TrendKey LevelsCycle StageCheap or ExpensiveWho Owns the CoinsNetwork & MiningCrowd Mood
Why are the five scores never added together?
Each score is built from its own measures and answers its own question: where the cycle stands, whether the price is cheap or expensive, whether people are buying or selling, how strong the network is and what mood the crowd is in. Adding them up would make a number none of the pages measures, so the reading above puts them side by side. Cycle StageCheap or ExpensiveWho Owns the CoinsNetwork & MiningFear & Greed
Where are ETFs, exchanges and company treasuries?
Each has a section of its own, listed under Markets in the menu: the funds that hold coins, the exchanges, the companies that keep Bitcoin, futures and forced closures, and the businesses that hold coins for other people. The news has its own section too. Crypto ETFsExchangesCompany treasuriesFuturesLiquidationsBusinesses holding bitcoinNews
Why do the cards show different days?
Each card is its own section's latest reading. The scores are published once a day, the chart readings on the daily close, and the price card follows the live price, so each card prints the day its number describes. The Cross Markets card opens its section without a figure, so it prints no day.
Where do the numbers come from?
Maketo's own reading of the Bitcoin chain, and its daily record of the price and of trading at the exchanges it follows. Each section states its method on its own pages.
Source: Maketo's own reading of the Bitcoin chain and its daily record of the price and trading. Reading for .