

BITCOIN SUPPORT AND RESISTANCE LEVELS
Which floors and ceilings sit closest to Bitcoin's price?
Big orders, past trading, what owners paid, past highs and lows and long-term price lines, on one map around Bitcoin's price. Traders call a floor under the price support, and a ceiling over it resistance.
The nearest bands, day by dayInside a band
As ofThe price sits inside the $84,204 to $84,625 band.
Nearest first, by distance from this price only.Nothing here is ranked by strength.
Price with the day-by-day bands
Orange bands sit under the price, blue bands over it, and a tan band has the price inside it. Each band and each dashed line starts on the day it first appeared and is never drawn earlier, so one that is new today has no width yet. The dashed lines mark the nearest floor and ceiling, measured from $84,228 as of 20:30 UTC on 2 Oct 2026.
Right now
Day by day, the price sits inside the $84,204 to $84,625 band. The nearest support is $83,785 to $84,204 and the nearest resistance is $84,625 to $85,048.
Measured from $84,228, halfway between the best waiting buy and sell orders, as of 20:30 UTC on 2 Oct 2026.
Day by day: nearest support and resistance
The price sits inside the $84,204 to $84,625 band, marked by what many owners paid. The nearest floor runs from $83,785 to $84,204, marked by big buy orders. The nearest ceiling runs from $84,625 to $85,048, marked by big sell orders and what many owners paid.
9 bands between $77,490 and $90,967, each half a percent wide, measured from $84,228 as of 20:30 UTC on 2 Oct 2026.
Week by week: nearest support and resistance
The price sits inside the $84,630 to $86,330 band, marked by what many owners paid and a past high. The nearest floor runs from $82,950 to $84,630, marked by what many owners paid and a past low. The nearest ceiling runs from $86,330 to $88,070, marked by what many owners paid and past highs.
11 bands between $63,640 and $106,070, each about 2% wide, measured from $84,853, the close of 1 Oct 2026.
Across the cycle: nearest support and resistance
The price sits inside the $81,310 to $86,330 band, marked by past highs and lows. The nearest floor runs from $76,590 to $81,310, marked by a past low and a long-term price line. The nearest ceiling runs from $86,330 to $91,660, marked by what many owners paid, past highs and a long-term price line.
16 bands between $21,210 and $169,700, each about 6% wide, measured from $84,853, the close of 1 Oct 2026.
What could not be checked
Where evidence could not be seen this hour, each view says so here rather than showing an empty price as if nothing were there.
- Day by day
- Waiting orders could only be seen part of the way across this range. Heavy past trading has nothing in this range.
- Week by week
- Waiting orders could only be seen part of the way across this range. Big orders sit in this range at a size that does not fit this view's bands, so they are in the background only. Heavy past trading sits in this range at a size that does not fit this view's bands, so it is in the background only.
- Across the cycle
- Waiting orders could only be seen part of the way across this range. Big orders sit in this range at a size that does not fit this view's bands, so they are in the background only.
How to read it
A band is a price range where something was found, not a promise about what the price does next.
The table below lists every reading behind every band, with its date and a link to the page it comes from.
The evidence behind every band
In the background means found at that price but not counted on that view. Not checked here names evidence that could not be seen at that price.
Day by day: 9 bands
| Band | Support or resistance | Evidence | Reading | As of | Its page |
|---|---|---|---|---|---|
| $88,512 to $88,9554th over the priceOn the list since Also here: owners in the backgroundNot checked here: big orders | Resistance | Two-year averageLong-term price lines | $88,704.34 | Price vs 2-Year | |
| $87,197 to $87,6333rd over the priceOn the list since Also here: a recent high-low channel, a Fibonacci level, owners in the backgroundNot checked here: big orders | Resistance | Last full week's highPast highs and lows | $87,397 | Bitcoin Price | |
| Last full month's highPast highs and lows | $87,397 | Bitcoin Price | |||
| $85,048 to $85,4742nd over the priceOn the list since Also here: pivot points, owners in the background | Resistance | Big sell ordersBig orders | $85,048.37 to $85,473.81 | Buy & Sell Walls | |
| Previous day's highPast highs and lows | $85,244 | Bitcoin Price | |||
| $84,625 to $85,0481st over the priceOn the list since Also here: a round number, owners in the background | Resistance | Big sell ordersBig orders | $84,625.05 to $85,048.37 | Buy & Sell Walls | |
| Where the most coins sit per dollarWhat owners paid | $84,187 to $84,929 | Where People Bought | |||
| $84,204 to $84,625Has the price inside itOn the list since Also here: owners in the background | Price inside | Where the most coins sit per dollarWhat owners paid | $84,187 to $84,929 | Where People Bought | |
| $83,785 to $84,2041st under the priceOn the list since Also here: pivot points, a round number, owners in the background | Support | Big buy ordersBig orders | $83,784.72 to $84,203.84 | Buy & Sell Walls | |
| $82,953 to $83,3682nd under the priceOn the list since Also here: a round number, owners in the background | Support | Previous day's lowPast highs and lows | $83,130.14 | Bitcoin Price | |
| $80,506 to $80,9093rd under the priceOn the list since Also here: owners in the backgroundNot checked here: big orders | Support | Last full week's lowPast highs and lows | $80,850.22 | Bitcoin Price | |
| $77,743 to $78,1314th under the priceOn the list since Also here: a round number, owners in the backgroundNot checked here: big orders | Support | 350-day averageLong-term price lines | $78,105.33 | Cycle Ceilings |
Week by week: 11 bands
| Band | Support or resistance | Evidence | Reading | As of | Its page |
|---|---|---|---|---|---|
| $88,070 to $89,8502nd over the priceOn the list since Also here: a round number, owners in the backgroundNot checked here: big orders | Resistance | Two-year averageLong-term price lines | $88,704.34 | Price vs 2-Year | |
| $86,330 to $88,0701st over the priceOn the list since Also here: pivot points, a recent high-low channel, a Fibonacci level, a round number, owners in the backgroundNot checked here: big orders | Resistance | Where patient holders boughtWhat owners paid | $84,221 to $87,569 | Where People Bought | |
| Last full week's highPast highs and lows | $87,397 | Bitcoin Price | |||
| Last full month's highPast highs and lows | $87,397 | Bitcoin Price | |||
| $84,630 to $86,330Has the price inside itOn the list since Also here: pivot points, a round number, big orders in the background, owners in the background | Price inside | Where patient holders boughtWhat owners paid | $84,221 to $87,569 | Where People Bought | |
| Previous day's highPast highs and lows | $85,244 | Bitcoin Price | |||
| $82,950 to $84,6301st under the priceOn the list since Also here: pivot points, a round number, big orders in the background, owners in the background | Support | Where owners of all coins boughtWhat owners paid | $83,175 to $84,301 | Where People Bought | |
| Where the most coins sit per dollarWhat owners paid | $83,174 to $84,187 | Where People Bought | |||
| Previous day's lowPast highs and lows | $83,130.14 | Bitcoin Price | |||
| $79,710 to $81,3102nd under the priceOn the list since Also here: pivot points, a recent high-low channel, a Fibonacci level, a round number, owners in the backgroundNot checked here: big orders | Support | Last full week's lowPast highs and lows | $80,850.22 | Bitcoin Price | |
| $76,590 to $78,1303rd under the priceOn the list since Also here: a round number, owners in the backgroundNot checked here: big orders | Support | 350-day averageLong-term price lines | $78,105.33 | Cycle Ceilings | |
| $73,590 to $75,0704th under the priceOn the list since Also here: a recent high-low channel, a round number, past trading in the background, owners in the backgroundNot checked here: big orders | Support | Last full month's lowPast highs and lows | $74,913.43 | Bitcoin Price | |
| $72,140 to $73,5905th under the priceOn the list since Also here: a Fibonacci level, a round number, past trading in the background, owners in the backgroundNot checked here: big orders | Support | Average buy price of recent buyersLong-term price lines | $73,443.95 | Avg Buy Price | |
| $70,710 to $72,1406th under the priceOn the list since Also here: a round number, past trading in the background, owners in the backgroundNot checked here: big orders | Support | 200-day averageLong-term price lines | $71,327.43 | Price vs 200-Day | |
| $65,280 to $66,6007th under the priceOn the list since Also here: a round number, past trading in the background, owners in the backgroundNot checked here: big orders | Support | Where owners of all coins boughtWhat owners paid | $63,714 to $66,120 | Where People Bought | |
| 200-week averageLong-term price lines | $66,174 | Price vs 200-Week | |||
| $63,990 to $65,2808th under the priceOn the list since Also here: a Fibonacci level, a round number, past trading in the background, owners in the backgroundNot checked here: big orders | Support | Where owners of all coins boughtWhat owners paid | $63,714 to $66,120 | Where People Bought |
Across the cycle: 16 bands
| Band | Support or resistance | Evidence | Reading | As of | Its page |
|---|---|---|---|---|---|
| $147,980 to $157,1105th over the priceOn the list since Also here: a round numberNot checked here: big orders | Resistance | 350-day average, times 2Long-term price lines | $156,210.65 | Cycle Ceilings | |
| $139,380 to $147,9804th over the priceOn the list since Also here: a round numberNot checked here: big orders | Resistance | Long-term trend lineLong-term price lines | $142,068.58 | Long-Term Trend | |
| $123,650 to $131,2803rd over the priceOn the list since Also here: a round number, owners in the backgroundNot checked here: big orders | Resistance | All-time highPast highs and lows | $126,236 | All-Time High | |
| 350-day average, times 1.6Long-term price lines | $124,968.52 | Cycle Ceilings | |||
| $109,690 to $116,4602nd over the priceOn the list since Also here: a round number, owners in the backgroundNot checked here: big orders | Resistance | Where patient holders boughtWhat owners paid | $107,210 to $113,270 | Where People Bought | |
| $86,330 to $91,6601st over the priceOn the list since Also here: pivot points, a recent high-low channel, a Fibonacci level, a round number, owners in the backgroundNot checked here: big orders | Resistance | Where patient holders boughtWhat owners paid | $87,569 to $92,693 | Where People Bought | |
| Last full week's highPast highs and lows | $87,397 | Bitcoin Price | |||
| Last full month's highPast highs and lows | $87,397 | Bitcoin Price | |||
| Two-year averageLong-term price lines | $88,704.34 | Price vs 2-Year | |||
| $81,310 to $86,330Has the price inside itOn the list since Also here: pivot points, the average traded price, a round number, big orders in the background, owners in the background | Price inside | Previous day's highPast highs and lows | $85,244 | Bitcoin Price | |
| Previous day's lowPast highs and lows | $83,130.14 | Bitcoin Price | |||
| $76,590 to $81,3101st under the priceOn the list since Also here: pivot points, a recent high-low channel, a Fibonacci level, a round number, owners in the backgroundNot checked here: big orders | Support | Last full week's lowPast highs and lows | $80,850.22 | Bitcoin Price | |
| 350-day averageLong-term price lines | $78,105.33 | Cycle Ceilings | |||
| $72,140 to $76,5902nd under the priceOn the list since Also here: a recent high-low channel, a Fibonacci level, a round number, past trading in the background, owners in the backgroundNot checked here: big orders | Support | Last full month's lowPast highs and lows | $74,913.43 | Bitcoin Price | |
| Average buy price of recent buyersLong-term price lines | $73,443.95 | Avg Buy Price | |||
| $67,940 to $72,1403rd under the priceOn the list since Also here: a Fibonacci level, a round number, past trading in the background, owners in the backgroundNot checked here: big orders | Support | 200-day averageLong-term price lines | $71,327.43 | Price vs 200-Day | |
| $63,990 to $67,9404th under the priceOn the list since Also here: a Fibonacci level, a round number, owners in the backgroundNot checked here: big orders | Support | The most traded price areaPast trading | $63,231.4 to $66,978.85 | Volume by Price | |
| Where owners of all coins boughtWhat owners paid | $63,714 to $66,120 | Where People Bought | |||
| 200-week averageLong-term price lines | $66,174 | Price vs 200-Week | |||
| $53,470 to $56,7705th under the priceOn the list since Also here: a round number, owners in the backgroundNot checked here: big orders | Support | Average buy price of all coinsLong-term price lines | $53,609.92 | Avg Buy Price | |
| $47,440 to $50,3606th under the priceOn the list since Also here: a round number, past trading in the background, owners in the backgroundNot checked here: big orders | Support | Average buy price of long-term holdersLong-term price lines | $49,378.54 | Avg Buy Price | |
| $42,080 to $44,6807th under the priceOn the list since Also here: a round number, owners in the backgroundNot checked here: big orders | Support | A heavily traded price areaPast trading | $42,257.02 to $44,761.4 | Volume by Price | |
| $35,160 to $37,3308th under the priceOn the list since Also here: a round number, owners in the backgroundNot checked here: big orders | Support | Bottom of the long-term corridorLong-term price lines | $35,457.4 | Long-Term Trend | |
| $26,070 to $27,6709th under the priceOn the list since Also here: a round number, past trading in the background, owners in the backgroundNot checked here: big orders | Support | A heavily traded price areaPast trading | $26,659.99 to $28,240.01 | Volume by Price | |
| $21,780 to $23,12010th under the priceOn the list since Also here: a round number, owners in the backgroundNot checked here: big orders | Support | A heavily traded price areaPast trading | $22,430.83 to $23,760.21 | Volume by Price |
Understanding
Bitcoin Support and Resistance Levels
Where it stands today
On the day-by-day view, the nearest floor under Bitcoin's price runs from $83,785 to $84,204 as of .
What does this page show?
Every hour, Maketo lays a fixed ladder of price bands over Bitcoin's price and checks which bands have evidence of a floor or a ceiling in them. Five kinds of evidence count: big orders waiting to buy or sell, prices where a lot of trading happened, prices where many of today's owners bought, past highs and lows, and long-term price lines such as the 200-week average. A band where at least one of them sits makes the list. Traders call a band like that support when it sits under the price and resistance when it sits over it. Those two words mean the floor and the ceiling.
Why three views?
The same price can matter over a day and not over a year. Days uses bands half a percent wide, within 8% of the price, measured from the price halfway between the best waiting buy and sell orders at a stated time. Weeks uses bands about 2% wide, within 25% of the last daily close. The cycle uses bands about 6% wide, from a quarter of that close to twice it. Some evidence is spread over more prices than a thin band covers, which is why what owners paid counts in the wider views and big orders only count day by day.
What does the date on each band mean?
Each band carries the hour it first appeared in an unbroken run of hourly checks. If a band drops out for even one hour, its date starts again. The chart draws each band from that day forward and never earlier, so a band that is new today is on the list and in the table but has no width on the chart yet.
Why can some evidence not be checked?
Some evidence cannot be seen at every price. Waiting orders only reach so far from the price, a reading can be out of date for an hour, and a kind of evidence can be too wide or too narrow for a view's bands. Where that happens the page says so, view by view and band by band, rather than treating the gap as a price with nothing there.
Does a floor stop the price falling?
A floor or a ceiling here is a price where something was found, not a promise about what the price does next, and the price can move through any of them. Nothing on this page has measured how often these bands turned the price, so it makes no claim that they do. It is a map, not advice to buy or sell.
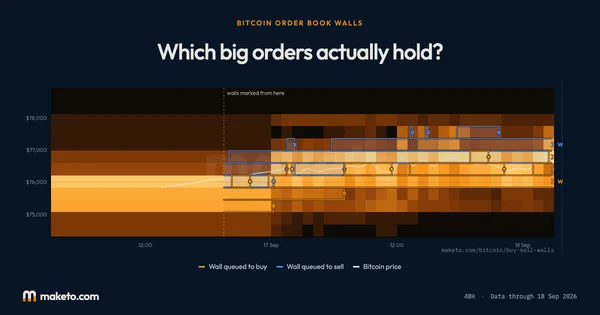

Source: Maketo's hourly check of the prices under and over Bitcoin, in three views, with every reading behind every band. Reading for .