

BITCOIN CROSS MARKETS
How does Bitcoin compare with the wider economy?
Bitcoin next to gold, oil, everyday prices, interest rates and the dollar. Each card is one page, with its latest figure and a small picture of its main chart.
Every Cross Markets page
Bitcoin vs Gold
20.01Troy ounces of gold one Bitcoin buysHow much gold can one Bitcoin buy?
Reading for Open the chart ↗Bitcoin against other prices↗Bitcoin vs Silver
1,441Troy ounces of silver one Bitcoin buysHow much silver can one Bitcoin buy?
Reading for Open the chart ↗Bitcoin against other prices↗Bitcoin vs Oil
841Barrels of US crude oil one Bitcoin buysHow much oil can one Bitcoin buy?
Reading for Open the chart ↗Bitcoin against other prices↗Buying Power
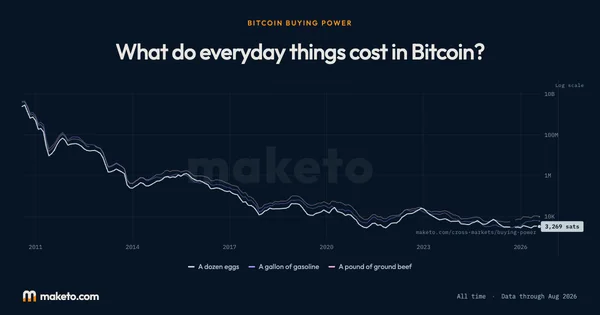
2,823 satsA dozen eggs in the US, or $2.27. A sat is one hundred-millionth of a Bitcoin.What do everyday things cost in Bitcoin?
A dozen eggsA gallon of gasolineA pound of ground beefReading for Open the chart ↗Bitcoin against other prices↗What Moves With Bitcoin
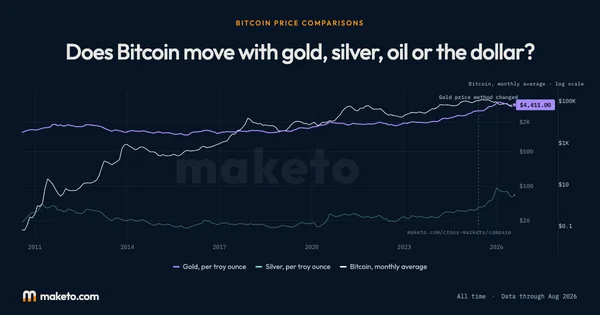
Hardly at allNone of gold, silver, oil or the dollar moved much like Bitcoin over the last three years. Silver came closest.Does Bitcoin move with gold, silver, oil or the dollar?
Gold, per troy ounceSilver, per troy ounceBitcoin, monthly averageReading for Open the chart ↗Money and prices↗Money Supply
$23.4 trillionIn US cash, bank accounts and money market fundsHow much money is there, and is it growing?
US money supplyBitcoin, monthly averageReading for Open the chart ↗Money and prices↗Inflation
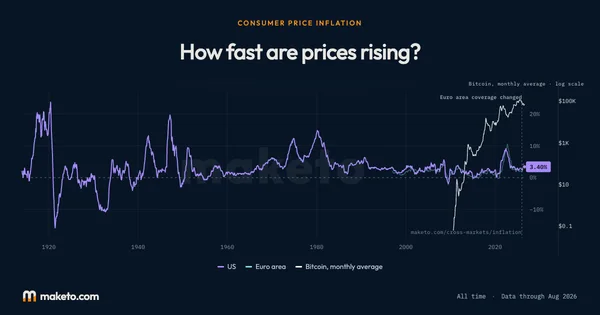
+3.7%How much US prices rose in a yearHow fast are prices rising?
USEuro areaBitcoin, monthly averageReading for Open the chart ↗Money and prices↗Dollar Strength
21.7% strongerThe dollar against the currencies of the countries the US trades with most, compared with January 2006How strong is the dollar?
Dollar vs trading partnersBitcoin, closing priceReading for Open the chart ↗Money and prices↗Central Bank Assets
$6.7 trillionHeld by the US Federal ReserveHow much do central banks own?
Federal Reserve assetsBitcoin, closing priceReading for Open the chart ↗Borrowing and growth↗Interest Rates
3.88%What banks in the US typically pay to borrow overnightWhat interest rates are central banks setting?
Rate banks paidFederal Reserve range, topFederal Reserve range, bottomBitcoin, closing priceReading for Open the chart ↗Borrowing and growth↗Bond Yields
4.86%What a ten-year US government bond pays a yearWhat do government bonds pay?
Ten-year bondTwo-year bondBitcoin, closing priceReading for Open the chart ↗Borrowing and growth↗Economic Growth
+2.1%How much more the US produced than a year earlierAre the US and euro area economies growing?
USEuro areaBitcoin, quarterly averageReading for Open the chart ↗Borrowing and growth↗Jobs
+165,000 jobsChange in US jobs in the latest monthIs the US adding jobs?
Jobs added or lostBitcoin, monthly averageReading for Open the chart ↗Each card’s figure is for its own period, because each is published on its own schedule.
Right now
What can't these charts tell you?
None of these charts says where Bitcoin will go next. Each one shows what has already happened, up to its latest published figure.
Understanding
Bitcoin and the Wider Economy
Where it stands today
One Bitcoin buys 20.01 troy ounces of gold as of .
One Bitcoin buys 1,441 troy ounces of silver as of .
One Bitcoin buys 841 barrels of US crude oil as of .
A dozen eggs costs 2,823 sats ($2.27) in the US as of .
None of gold, silver, oil or the dollar moved much like Bitcoin over the past three years as of .
The US has $23.4 trillion in cash, bank accounts and money market funds, 5.7% more than a year earlier as of .
US prices are 3.7% higher than a year earlier as of .
Measured from January 2006, the dollar is 21.7% stronger against the currencies of the countries the US trades with most as of .
The US Federal Reserve holds $6.7 trillion in assets as of .
The Federal Reserve aims to keep the rate banks pay to borrow overnight between 3.75% and 4.00% a year, and banks typically paid 3.88% as of .
A ten-year US government bond pays 4.86% a year as of .
After taking out price rises, the US economy produced 2.1% more than a year earlier as of .
The US added 165,000 jobs in the latest month as of .
What is on this page?
A card for every Cross Markets page: Bitcoin measured in gold, silver, oil and everyday prices, and the wider economy's money, prices, interest rates, growth and jobs. Each card shows its page's latest figure and a small picture of the chart that page opens on.
Why put Bitcoin next to the wider economy?
Bitcoin is priced in dollars, and the dollar, interest rates and everyday prices all move around it. Seeing them side by side helps tell apart what Bitcoin did from what the money it is measured in did.
Why do the cards show different periods?
Each figure is published on its own schedule: interest rates, bond yields and the dollar every working day, central bank holdings every week, most prices every month and growth every quarter. Each card names the period its figure is for.
Where do the figures come from?
From official statistics publishers, each named in the source line at the end of this page, and from Maketo's own record of Bitcoin's price. Some figures, such as ounces of gold per Bitcoin, Maketo works out from the published numbers.
Keep exploring
Source: Maketo, U.S. Bureau of Economic Analysis, U.S. Bureau of Labor Statistics, Deutsche Bundesbank, ECB statistics, Eurostat, Federal Reserve Board, Federal Reserve Bank of New York, U.S. Treasury, World Bank, Commodity Price Data (The Pink Sheet), CC BY 4.0. This product uses the Bureau of Economic Analysis (BEA) Data API but is not endorsed or certified by BEA. BLS.gov cannot vouch for the data or analyses derived from these data after the data have been retrieved from BLS.gov. The reference-rate information is subject to the Terms of Use posted at newyorkfed.org. The New York Fed is not responsible for publication of the reference-rate information by Maketo, does not sanction or endorse any particular republication, and has no liability for your use. Reading for .