

BITCOIN ORDER BOOK DEPTH
Where are buyers and sellers waiting?
See the prices where real money is queued to buy and to sell right now, and which of those orders actually stay put.
What is queued at each price
Resting orders across 9 price steps around $82,549. Across the whole published book, $79.91M is queued to buy and $86.89M is queued to sell. 2 steps are named walls.
Every bar is one price step, half a percent wide. What is queued to buy runs left, what is queued to sell runs right, and the dashed line is the price at the end of the quarter hour. A bar marked W is a named wall. Each bar is the average over the quarter hour from 16:30 to 16:45 UTC on 20 Oct 2026, added up across the 4 exchanges we watch, and steps holding under half a million dollars are left off.
The same book through time
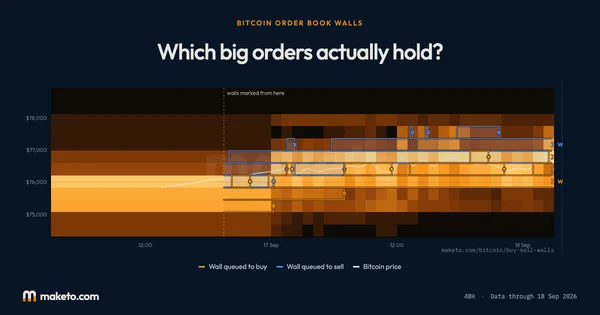
70 readings of the book, from 20 Sep 2026 to 20 Oct 2026. The newest 41 are one hour each and the rest one day each. Price runs up the side and a brighter block means more money resting at that price then, against the busiest price in view.
The same book through time. Each column is one reading, price runs up the side, and a brighter block means more money resting at that price then, both sides together. The pale line is the price itself, taken from each column's own reading rather than from today's, so the sides stay honest all the way back. The newest columns are one hour each and the older ones one day.
Brightness is measured against the busiest price in view, so the map rescales when you change the range or zoom in. Read it for shape, not for a dollar figure.
Right now
$35.52M is queued to buy between $82,129 and $82,540, 0.3% below the price.
A step is named a wall only when three things hold: its orders were in the book for at least half of the quarter hour, it held at least as much as the typical step on its side in three of the last four quarter hours, and its size, scaled down by the share of the quarter hour its orders were there, is at least twice the typical step on its side. The size shown is that scaled figure, so an order that flashed up and left cannot pass as a wall.
Is there nothing on the sell side?
No step on the sell side passes the test for a wall in this quarter hour. That is a reading rather than a gap: money is still queued there, but no single price on that side stands out from the rest for long enough to be named.
How much is waiting close to the price?
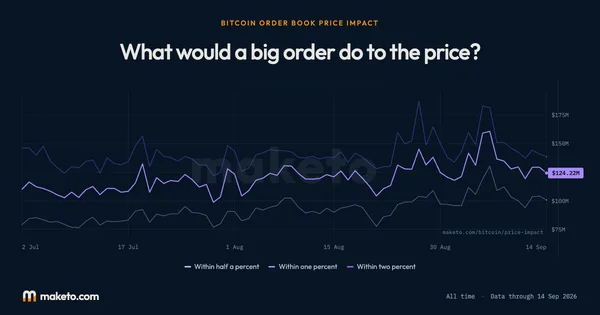
$115.18M is queued within half a percent of the price, $140.37M within one percent and $165.65M within two percent. Each distance holds everything inside it, and each exchange is measured from its own price before the exchanges are added together.
None of it is committed. Any of these offers can be withdrawn in the moment before the price arrives. The books reach a little past two percent, so the whole queue under the chart is larger: $79.91M to buy and $86.89M to sell.
Is the queue bunched up or spread out?
70% of everything waiting within two percent of the price sits within half a percent of it. The queue is packed against the price and thins out as you walk away from it.
The furthest any of these exchanges' books reached in that quarter hour was about 2.6% from the price. Past that we cannot see, which is not the same as nothing waiting there.
Which side has more waiting?
Close to even. For every 48 dollars queued to buy within two percent of the price there are 52 queued to sell.
This tips back and forth and it is not a forecast. Orders on either side can be withdrawn before the price gets near them.
How long do they stand?
Half of them stood for less than 4 hours and half for longer. 86% stood for at least an hour, 38% for at least six and 8% for half an hour or less. Standing for half an hour or less is the exception here, not the rule.
Counted across 1,279 spells since 2 Jul 2026. A wall still standing counts at the length it has stood so far, and each is timed from the quarter hour it was first named rather than from when the order was placed. A wall that moves to a nearby price is still counted as one wall. One that goes and later comes back is counted again, because nothing in the book says it is the same order. The longest we have recorded stood for 89 hours.
What ends them?
Of the 1,275 walls that have gone, the price reached 45% of them within the half hour in which they went. Another 37% went while the price stayed more than a step away, so those orders were withdrawn, or shrank back to an ordinary size, rather than being met. The remaining 18% we cannot call either way, and we would rather say so than pick the answer that reads better.
We say the price reached a wall, never that the wall was eaten. A book says what was offered and a candle says where the price went, and between them they cannot tell you which order was on the other side of a trade. Before we call it either way, the prices on at least three of the five exchanges we check them against have to agree.
What would a big order do to the price?
$100,000 at once would land the average dollar 0.003% from the price when buying and 0.004% when selling, averaged across 4 exchanges. $1 million at once would land the average dollar 0.018% from the price when buying and 0.018% when selling, averaged across 4 exchanges. $10 million at once would land the average dollar 0.152% from the price when buying and 0.201% when selling, averaged across 3 exchanges.
Worked out on the real offers rather than read off the picture above, averaged over the last hour, and recorded since 4 Sep 2026. The gap between the best price to buy at and the best price to sell at averaged 19 cents over the last hour on a coin worth $82,549, 0.00023% of the price, and 1 cent on the tightest exchange. Over the last 24 hours, counted at that price, it ran from 5.4 cents in the calmest minute to $5.54 in the widest.
What does this mean for you?
Treat this page as a map of intentions, not of outcomes. The money queued near the price is real money from real accounts, but none of it is committed: any of it can be taken away in the moment before the price arrives, and the record above shows that plenty of it is.
The walls worth watching are the ones that have already stood for hours rather than the biggest ones on screen, which is why a wall's size is scaled down by how much of the quarter hour its orders were there, instead of the largest figure it briefly touched. And because the exchanges publish only the queue nearest the price, a quiet map further out means we cannot see there, never that nobody is waiting.
Understanding
Bitcoin Order Book Depth
Where it stands today
On Bitcoin's order book, the biggest buy wall is a stack of orders waiting at a price of $82.3K as of .
What is an order book?
An exchange keeps a running list of every offer to buy and every offer to sell that nobody has taken yet. That list is the order book, and its depth is how much money is waiting at each price. This page adds up the books of the 4 exchanges we record into one picture, so you see the queue across all of them rather than one exchange's slice of it.
Why does the picture stop close to the price?
Read it as the neighbourhood around the price, not the whole map. Exchanges publish only the part of their book nearest the current price, so what you can see here reaches a few percent from it and then stops. That is a limit of what they hand out, not a sign that nothing is waiting further away. On the latest reading the furthest any of the exchanges' books reached was about 2.6% from its own price and 70% of what was queued within two percent of the price sat within half a percent of it, so the queue was thick right beside the price and thinned out as you walk away.
What makes a price a wall?
A price with an unusually large amount waiting at it gets called a wall. We name one only when it stands well above the typical step on its side, its orders were in the book for at least half of the quarter hour, and it has held at least the typical size in three of the last four quarter hours. A big order that flashes into a single reading and vanishes is not a floor, so size ranks the walls but staying power is what lets one be named at all. The size shown is scaled down by how much of the quarter hour its orders were there, rather than the largest figure it briefly touched. Traders call a price area like this support when it sits below the price and resistance when it sits above. It is the same idea as a floor and a ceiling.
Why keep a record instead of a picture?
A single picture of the book cannot tell you whether any of it will still be there when the price arrives. So we keep a record: for every quarter hour we check which walls are still standing. When a wall goes, we look at where the price went in that quarter hour and the one before, on the five exchanges we check prices against. If it traded inside the wall's step on at least three of them, we say the price reached it. If at least three reported and none came within a step of it, the orders were withdrawn, or shrank back to an ordinary size, rather than being met. Often we cannot tell, and the page says so rather than guessing.
What should you hold on to?
An order can be cancelled at any moment before the price gets there, so a wall is a plan and never a promise. The prices we use to judge a vanished wall come from a slightly wider set of exchanges than the books themselves. For Bitcoin that is fair, because the exchanges' prices track each other closely, but it is a join between two records rather than one, and it is the reason we ask three of them to agree before calling anything.
The numbers
behind the chart
What does the current reading show?
Across everything the 4 exchanges we watch publish, $79.91M is queued to buy and $86.89M to sell. 9 price steps hold at least half a million dollars, on one side or both.
The reading covers the quarter hour from , and the price, taken at its end, is $82,549.
Each dollar figure is the average of that quarter hour’s one-minute readings, so money that sat in the book for half of it counts at half. A step holding under half a million dollars is left out of the chart and the table below, though it still counts in the totals.
What is queued at each price?
| Price step | Side | Waiting | Named a wall |
|---|---|---|---|
| $83,785 to $84,204 | Queued to sell | $8.48M | No |
| $83,368 to $83,785 | Queued to sell | $13.87M | No |
| $82,953 to $83,368 | Queued to sell | $7.74M | No |
| $82,540 to $82,953 | Queued to sell | $54.78M | No |
| $82,540 to $82,953 | Queued to buy | $12.71M | No |
| $82,129 to $82,540 | Queued to sell | $1.57M | No |
| $82,129 to $82,540 | Queued to buy | $35.52M | Yes |
| $81,720 to $82,129 | Queued to buy | $24.06M | Yes |
| $81,313 to $81,720 | Queued to buy | $4.37M | No |
| $80,909 to $81,313 | Queued to buy | $1.60M | No |
| $80,506 to $80,909 | Queued to buy | $1.64M | No |
How much is queued at each distance?
| Distance from the price | Queued to buy | Queued to sell | Both sides |
|---|---|---|---|
| Within half a percent | $58.83M | $56.35M | $115.18M |
| Within one percent | $72.28M | $68.08M | $140.37M |
| Within two percent | $79.21M | $86.44M | $165.65M |
What happened to the most recent large orders?
| Price | Side | Size | What happened | Stood for |
|---|---|---|---|---|
| $82,129 to $82,540 | buy | $35.55M | appeared | 15 minutes |
| $82,540 to $82,953 | sell | $43.23M | appeared | 15 minutes |
| $82,540 to $82,953 | buy | no longer there | gone, the price reached it | 60 minutes |
| $81,720 to $82,129 | buy | $6.02M ($9.72M) | appeared | 15 minutes |
| $82,540 to $82,953 | buy | $37.09M | appeared | 15 minutes |
| $81,313 to $81,720 | buy | no longer there | gone, cannot tell | 12.8 hours |
| $83,368 to $83,785 | sell | $30.30M | appeared | 15 minutes |
| $80,909 to $81,313 | buy | no longer there | gone, cannot tell | 8 hours |
| $81,720 to $82,129 | sell | no longer there | gone, the price reached it | 22.8 hours |
| $80,909 to $81,313 | buy | $14.18M | appeared | 15 minutes |
| $81,720 to $82,129 | buy | no longer there | gone, the price reached it | 2 hours |
| $82,129 to $82,540 | sell | no longer there | gone, cannot tell | 2 hours |
| $81,720 to $82,129 | buy | $49.57M | appeared | 15 minutes |
| $82,129 to $82,540 | sell | $18.68M | appeared | 15 minutes |
| $82,540 to $82,953 | sell | no longer there | gone, cannot tell | 27.3 hours |
| $81,313 to $81,720 | sell | no longer there | gone, the price reached it | 1.5 hours |
| $81,313 to $81,720 | buy | $53.35M | appeared | 15 minutes |
| $81,313 to $81,720 | sell | $10.94M ($11.05M) | appeared | 15 minutes |
| $81,313 to $81,720 | buy | no longer there | gone, the price reached it | 22.8 hours |
| $81,720 to $82,129 | buy | no longer there | gone, the price reached it | 24.5 hours |
| $82,129 to $82,540 | sell | no longer there | gone, cannot tell | 2.5 hours |
| $82,129 to $82,540 | sell | $17.86M | appeared | 15 minutes |
| $81,720 to $82,129 | sell | $27.13M | appeared | 15 minutes |
| $81,720 to $82,129 | sell | no longer there | gone, the price reached it | 75 minutes |
| $81,720 to $82,129 | sell | $29.97M | appeared | 15 minutes |
| $82,129 to $82,540 | buy | no longer there | gone, the price reached it | 1.8 hours |
| $82,129 to $82,540 | buy | $34.31M | appeared | 15 minutes |
| $81,720 to $82,129 | sell | no longer there | gone, the price reached it | 30 minutes |
| $81,720 to $82,129 | sell | $17.16M | appeared | 15 minutes |
| $81,313 to $81,720 | buy | $6.60M | moved | 8.8 hours |
A size is what the wall held in the quarter hour of that event, and a wall that has gone has no size left to show. Where a figure follows in brackets, one exchange alone had that much queued in the step at its busiest minute.
Source: Maketo’s own record of the orders resting on the exchanges we watch, taken every minute and summarised every quarter hour. Reading for .