

Bitcoin Market Cycle
Where is Bitcoin in its market cycle?
One 0 to 100 reading brings five long-term measures together, with every ingredient visible.
Latest Maketo reading
How does today compare with its history?
The score runs from 0 to 100 against the measures' own histories. Lower is more washed out, higher is more stretched, and the bands behind the line name each stretch.
Price uses its own log scale on the right. Compare timing, not vertical distance.
Inspect and compare dates
Choose two dates from the chart you are viewing. A date without a reading uses the last one before it.
| Measure | Change | ||
|---|---|---|---|
| Cycle-position score | 27 | 32 | +5 points |
Right now
Price sits low in its long-term range, like past bottoms, and most measures look early-cycle.
Most measures agree: four of the five sit early in the cycle and one sits in the middle.
What goes into the reading?Five long-running measures, each against its own history
Each one is scored out of 100 against its own past, then blended by the weights below. The score itself is smoothed over about a week.
- Market Profit24% of the score44 of 100 Mid-cycle.
- New Money's Share19% of the score34 of 100 Early recovery.
- Holder Confidence19% of the score33 of 100 Early recovery.
- 2-Year Average19% of the score25 of 100 Early recovery.
- Long-Term Range19% of the score24 of 100 Early recovery.
What changed recently?
Three measures moved enough this month to be worth naming.
- Rose: Lifting off the lowsWhere Bitcoin sits in its cycle rose from 27 to 32 out of 100, up off the lows.
- Rose: New money gained groundNew money's share rose about 10% this month.
- Fell: Holder confidence easedHolder confidence eased about 6% this month.
The arrow shows which way it moved. The colour shows whether that put Bitcoin earlier or later in the cycle.
How close is this to a classic top?Two models, neither of which moves the score
How close we are to the signals that marked past tops. These do not change the score.
| Measure | What it asks | Reading |
|---|---|---|
| Cycle Top | How close the two moving averages are to a classic top signal | 44% thereto the classic top signal |
| Cycle Ceilings | Price against the ceilings that capped past cycles | 1.07× the averagebelow the cycle-top ceiling |
What else frames the cycle?Four reads that add detail, and do not move the score
Framing reads that are not part of the score.
| Measure | What it asks | Reading |
|---|---|---|
| Long-Term Floor | Price next to its 200-week average, the historic floor | 1.26× the floor22nd pct of its range |
| All-Time High | How far below the record price Bitcoin is trading | 34% below peak357 days since the high |
| Market Share | Bitcoin's slice of the whole crypto market | 59%of all crypto value |
| Scarcity Model | A scarcity model, year by year | 81%below the model |
Where are we in the halving cycle?
Bitcoin's issuance halves about every four years, and the calendar below says how far through the current stretch we are.
Last halving 61%Next (estimated)
29 months into this halving epoch, with about 18 months left at Bitcoin's 10-minute target pace.
Is Bitcoin moving like the last cycle?
This comparison does not change the cycle-position score.
Bitcoin has moved differently from the last cycle recently.
The previous cycle has been an uneven guide to later price changes.
This comparison does not change the cycle-position score. See how this cycle compares
Understanding
Bitcoin Market Cycle
Where it stands today
Bitcoin's cycle-position score is 32 out of 100, which reads early recovery as of .
How is this score built?
The Cycle Position Index brings together five long-running measures of where Bitcoin sits in its cycle: market profit, the share held by newer buyers, holder confidence, price against its two-year average, and price within its long-term range. Each one is scored 0 to 100 against its own history, then blended into one reading. Past cycles may not repeat, and the score cannot time a top, bottom, or next move. Ingredients can also update at different times.
What do the numbers on the dial mean?
The dial runs from 0 to 100, where 0 is the most washed out Bitcoin has looked against its own history and 100 the most stretched. 0 to 20 reads deep downturn, 20 to 40 reads early recovery, 40 to 60 reads mid-cycle, 60 to 80 reads strong uptrend, 80 and above reads euphoric peak. The same bands sit behind the line on the chart, so a day's place on the chart and the word beside the dial are the same fact.
Do the five measures count equally?
No. They are weighted: market profit 24%, new money's share 19%, holder confidence 19%, 2-year average 19%, long-term range 19%. The weights are fixed, so a change in the score is a change in the measures and never a change in how they are counted. A measure with no fresh reading is left out of the day's blend rather than counted as neutral.
Can I add the weights up myself?
Yes, and it is worth saying what you will land on. The shares above describe today's reading, which works out at 33. The number at the top of the page smooths that over about a week, with the most recent days counting for more, so one unusual day cannot swing it.
Does a low score mean the bottom is in?
No. It says the measures sit low against what has been normal for them, which is a description of 28 Sep 2026, not a forecast. Readings have stayed low for months and stayed high for months, past cycles may not repeat, and this page is not advice.
Why show measures that do not count?
Because they answer the same question from angles the five do not, and because a score that quietly swallowed every number within reach would be impossible to check. The cycle-top models, the calendar reads, the halving stretch and the last cycle's shape all sit beside the score with their own readings, each linked to the page it comes from, and the score stays the five.
The numbers
behind the chart
What does the current reading show?
Cycle-position score: the latest reading is 32, on . The highest reading since is 77 on ; the lowest is 12 on .
Every reading is the blended score out of 100 for that day, from 30 Aug 2024 to 28 Sep 2026. The latest is 32, which reads early recovery.
What are the latest, highest and lowest readings?
| Measure | Latest | Highest | Lowest |
|---|---|---|---|
| Cycle-position score | 32 | 77 | 12 |
How do the readings compare with earlier dates?
| Reference date | Cycle-position score |
|---|---|
| 1 month ago | 27 |
| 3 months ago | 12 |
| 6 months ago | 22 |
| 1 year ago | 59 |
| 2 years ago | 55 |
What was the reading at each month’s end?
| Reading date | Cycle-position score |
|---|---|
| 29 | |
| 13 | |
| 12 | |
| 26 | |
| 31 | |
| 21 | |
| 20 | |
| 36 | |
| 37 | |
| 45 | |
| 55 | |
| 60 | |
| 61 | |
| 74 | |
| 65 | |
| 69 | |
| 62 | |
| 52 | |
| 59 | |
| 72 | |
| 71 | |
| 76 | |
| 59 | |
| 55 |
Keep exploring
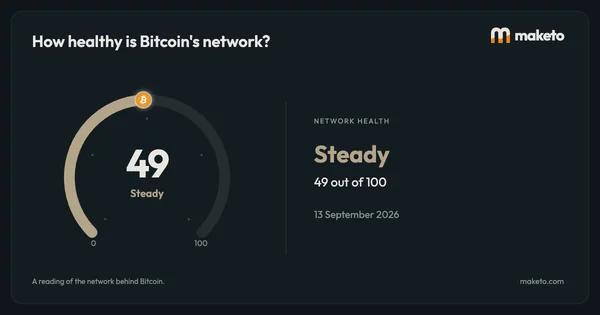
Source: Maketo blends five long-running measures of where Bitcoin sits in its cycle into one score, once a day. It describes today, and it is not advice. Reading for .