

Bitcoin Buying and Selling Index
Are people buying or selling Bitcoin?
One 0 to 100 reading brings six holder measures together, with every ingredient visible.
Latest Maketo reading
Explore the holder groups
The gauge above reads the market as one crowd. These pages split it into groups and follow each one: what they hold, what they paid, and what they are doing with it.
- By size of holdingFrom the smallest wallets to the largest: who owns the coins, what each group paid, who is in profit, and who is moving.
- By how long they've heldHow long every coin has sat still: which ages are selling and at what profit, how much each age moves, and the coins that may be lost for good.
- By when coins last movedEvery coin tagged by the year it last changed hands: how much of each year's class is still sitting, what those coins last went for, and how that bet looks today.
How does today compare with its history?
The score runs from 0 to 100. Above 50 buying and holding have the upper hand, below 50 selling does, and the bands behind the line name each stretch.
Price uses its own log scale on the right. Compare timing, not vertical distance.
Inspect and compare dates
Choose two dates from the chart you are viewing. A date without a reading uses the last one before it.
| Measure | Change | ||
|---|---|---|---|
| Buying and selling score | 50 | 64 | +14 points |
Right now
Long-held coins are staying put, even as big holders are trimming.
Pulling the same way: three of the six lean toward buying, one leans toward selling and two sit in the middle.
What goes into the reading?Six things Bitcoin owners do with their coins
Each one leans toward buying or selling, scaled by how big the move is against normal, then blended by the weights below. The score itself is smoothed over about a week.
- Patient Holders25% of the scoreUp 0.7 points this month91 of 100 Buying.
- Exchanges20% of the scoreNo fresh reading right now50 of 100 No data.
- Bitcoin Funds20% of the scoreAdded about 34K BTC this month66 of 100 Buying.
- Big Holders15% of the scoreTrimming this month32 of 100 Selling.
- Miners10% of the scoreBarely changed this month50 of 100 Mixed.
- Oldest Coins10% of the scoreStaying put this month56 of 100 Buying.
Who's pulling harder right now?
83% of the pull is on the buying side today.
What changed recently?
Five measures moved enough this month to be worth naming.
- Rose: Bitcoin funds kept addingFunds added about 33K BTC over the past month.
- Rose: Exchange pressure easedAbout 25K BTC left the exchange wallets we can trace over the past month.
- Fell: Miners sold downMiners sent about 3K BTC out of their wallets this month.
- Rose: Patient holders strengthenedThe one-year-plus share rose 0.7 points this month.
- Fell: Recent buyers thinned outThe under-one-year share fell 0.7 points this month.
The arrow shows which way it moved. The colour shows whether that leaned toward buying or toward selling.
What else is worth watching?Four reads that add detail, and do not move the score
Four wider reads that add detail. None of them moves today's score.
| Measure | Reading |
|---|---|
| Recent Buyers | 36.7%−0.7 pts this month |
| Fresh Coins | 6.6%−1.3 pts this month |
| Coin Age Mix | 63.3%held at least a year |
| Coin Age on the Move | 47 days54 out of 100 vs. 4 years |
Understanding
Bitcoin Buying and Selling Index
Where it stands today
Bitcoin's buying and selling score is 64 out of 100, which reads buying as of .
How is this score built?
The Buying / Selling Index blends six things Bitcoin owners do with their coins: long-held coins sitting still or moving, coins going onto or off exchanges, money moving in or out of Bitcoin funds, what big holders are doing, whether miners are selling, and whether the oldest coins are waking up. Each one leans toward buying or selling, scaled by how big the move is compared to normal. We roll them into one reading from 0 to 100. Low means coins are being sold, high means they are being bought and held, and the middle means the crowd is split.
What do the numbers on the dial mean?
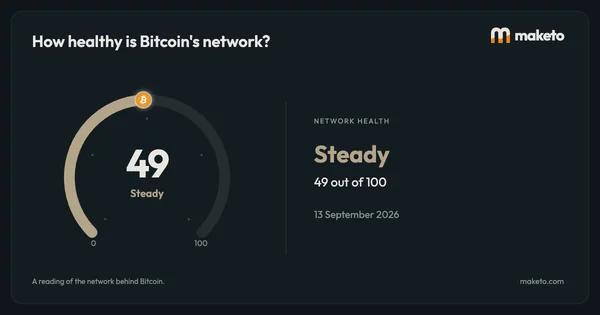
The dial runs from 0 to 100, where 0 is as far toward selling as this reading gets and 100 as far toward buying. 0 to 20 reads selling hard, 20 to 40 reads selling, 40 to 60 reads mixed, 60 to 80 reads buying, 80 and above reads buying hard. The same bands sit behind the line on the chart, so a day's place on the chart and the word beside the dial are the same fact.
Do the six measures count equally?
No. They are weighted: patient holders 25%, exchanges 20%, bitcoin funds 20%, big holders 15%, miners 10%, oldest coins 10%. The weights are fixed, so a change in the score is a change in what holders did and never a change in how they are counted. A measure with no fresh reading is left out of the day's blend rather than counted as neutral.
Can I add the weights up myself?
Yes, and it is worth saying what you will land on. The shares above describe today's reading, which works out at 64. One of them has no reading today, so the rest cover its share between them. The number at the top of the page smooths that over about a week, with the most recent days counting for more, so one unusual day cannot swing it.
Does a high score mean the price will rise?
No. It says more of what holders did leaned toward buying and holding than toward selling, which is a description of 28 Sep 2026, not a forecast. Buying has met selling at every price Bitcoin has ever traded at, and this page is not advice.
Why show measures that do not count?
Because they answer the same question from angles the six do not, and because a score that quietly swallowed every number within reach would be impossible to check. The wider reads sit beside the score with their own readings, each linked to the page it comes from, and the score stays the six.
One important limit
This tracks wallet addresses and fund accounts, not a headcount of people. One person can control many addresses, and a large transfer does not reveal why the coins moved.
The numbers
behind the chart
What does the current reading show?
Buying and selling score: the latest reading is 64, on . The highest reading since is 71 on ; the lowest is 20 on .
Every reading is the blended score out of 100 for that day, from 29 Aug 2024 to 28 Sep 2026. The latest is 64, which reads buying.
What are the latest, highest and lowest readings?
| Measure | Latest | Highest | Lowest |
|---|---|---|---|
| Buying and selling score | 64 | 71 | 20 |
How do the readings compare with earlier dates?
| Reference date | Buying and selling score |
|---|---|
| 1 month ago | 51 |
| 3 months ago | 61 |
| 6 months ago | 70 |
| 1 year ago | 50 |
| 2 years ago | 55 |
What was the reading at each month’s end?
| Reading date | Buying and selling score |
|---|---|
| 52 | |
| 62 | |
| 59 | |
| 53 | |
| 60 | |
| 67 | |
| 48 | |
| 49 | |
| 60 | |
| 20 | |
| 65 | |
| 50 | |
| 42 | |
| 48 | |
| 69 | |
| 50 | |
| 52 | |
| 61 | |
| 45 | |
| 57 | |
| 57 | |
| 52 | |
| 43 | |
| 55 |
Keep exploring
Source: Maketo blends six measures of what Bitcoin owners are doing with their coins into one score, once a day. It describes today, and it is not advice. Reading for .