

Bitcoin Valuation
Is Bitcoin cheap or expensive?
Six ways to measure what Bitcoin costs, each against its own history, in one reading.
Latest Maketo reading
How does today compare with its history?
The score runs from 0 to 100 against Bitcoin's own history. Lower is cheaper, higher is more expensive, and the bands behind the line name each stretch.
Price uses its own log scale on the right. Compare timing, not vertical distance.
Inspect and compare dates
Choose two dates from the chart you are viewing. A date without a reading uses the last one before it.
| Measure | Change | ||
|---|---|---|---|
| Cheap / expensive score | 38 | 41 | +3 points |
Right now
Price sits low in its long-term range, but price vs. its 200-day average is in its usual range.
Some measures disagree: two of the six lean cheap and four sit in the middle.
What goes into the reading?Six measures, each against its own history
Each one is scored out of 100 against its own past, then blended by the weights below. The score itself is smoothed over about a week.
- Price vs. Cost25% of the score44 of 100 Sits at the 44th percentile of its 4-year range.
- Price vs. 200-Day Avg15% of the score57 of 100 Sits at the 57th percentile of its whole history.
- Price vs. Long-Term Trend15% of the score24 of 100 Sits at the 24th percentile of its 4-year range.
- Network Value15% of the score27 of 100 Sits at the 27th percentile of its 4-year range.
- Mining Spend15% of the score51 of 100 Sits at the 51st percentile of its 4-year range.
- Coins in Profit15% of the score43 of 100 Sits at the 43rd percentile of its 4-year range.
What changed recently?
Five measures moved enough this month to be worth naming.
- Rose: More coins in profitThe share of coins in profit rose to about 71%, from about 68% a month ago.
- Rose: Price rose vs. what holders paidPrice compared with what holders paid moved about 7% higher this month.
- Fell: Network value fell vs. its useThis month, the network's value moved about 7% down against how much it gets used.
- Rose: Price rose vs. mining spendThis month, price moved about 7% up against everything ever spent on mining.
- Rose: Price gained on its 200-day averagePrice went from 1.13× to 1.17× its 200-day average over the past month.
The arrow shows which way it moved. The colour shows whether that made Bitcoin look cheaper or pricier.
Five more anglesThese add detail, and do not move the score
The five context reads show how unusual holder profits are, the average buy price, what recent buyers paid, seller profitability, and value next to what investors put in. They add detail but do not change the six-measure score.
| Measure | What it asks | Reading |
|---|---|---|
| Profit vs. Usual | How unusual holder profits are against their own four-year history | 0.4 stepsbelow 4-year avg |
| Avg Buy Price | The average price every coin last moved at | Price 56%above avg paid |
| Cost by Age | What recent buyers paid on average | Price 14%above recent buyers' avg |
| Seller Profitability | Whether coins are selling at a profit or a loss | In profit |
| Value vs. Invested | Price next to what investors put in | 30%above investor cost |
Understanding
Bitcoin Valuation
Where it stands today
Bitcoin's cheap / expensive score is 41 out of 100, which reads fairly priced as of .
How is this score built?
The Cheap / Expensive Index blends six ways of asking the same question: is Bitcoin's price high or low compared with what's been normal for it? It looks at price next to what holders paid, price against its 200-day average and its long-term growth path, the network's value next to how much it gets used and what's been spent on mining, and how many coins are sitting in profit. Each one is scored from 0 to 100 against its own history, then blended into one reading. Low means cheaper than normal. High means more expensive. It describes today, not tomorrow, and it isn't advice.
What do the numbers on the dial mean?
The dial runs from 0 to 100, where 0 is the cheapest Bitcoin has looked against its own history and 100 the most expensive. 0 to 20 reads extremely cheap, 20 to 40 reads cheap, 40 to 60 reads fairly priced, 60 to 80 reads expensive, 80 and above reads extremely expensive. The same bands sit behind the line on the chart, so a day's place on the chart and the word beside the dial are the same fact.
Do the six measures count equally?
No. They are weighted: price vs. cost 25%, price vs. 200-day avg 15%, price vs. long-term trend 15%, network value 15%, mining spend 15%, coins in profit 15%. The weights are fixed, so a change in the score is a change in the measures and never a change in how they are counted. A measure with no fresh reading is left out of the day's blend rather than counted as neutral.
Can I add the weights up myself?
Yes, and it is worth saying what you will land on. The shares above describe today's reading, which works out at 41. The number at the top of the page smooths that over about a week, with the most recent days counting for more, so one unusual day cannot swing it.
Does a low score mean Bitcoin is about to rise?
No. It says Bitcoin's price is low against what has been normal for it, which is a description of 28 Sep 2026, not a forecast. Readings have stayed low for months and stayed high for months. This page is not advice.
Why show five measures that do not count?
Because they answer the same question from angles the six do not, and because a score that quietly swallowed every number within reach would be impossible to check. They sit beside the score with their own readings, each linked to the page it comes from, and the score stays the six.
The numbers
behind the chart
What does the current reading show?
Cheap / expensive score: the latest reading is 41, on . The highest reading since is 84 on ; the lowest is 18 on .
Every reading is the blended score out of 100 for that day, from 30 Aug 2024 to 28 Sep 2026. The latest is 41, which reads fairly priced.
What are the latest, highest and lowest readings?
| Measure | Latest | Highest | Lowest |
|---|---|---|---|
| Cheap / expensive score | 41 | 84 | 18 |
How do the readings compare with earlier dates?
| Reference date | Cheap / expensive score |
|---|---|
| 1 month ago | 38 |
| 3 months ago | 22 |
| 6 months ago | 23 |
| 1 year ago | 65 |
| 2 years ago | 57 |
What was the reading at each month’s end?
| Reading date | Cheap / expensive score |
|---|---|
| 38 | |
| 26 | |
| 22 | |
| 35 | |
| 37 | |
| 22 | |
| 18 | |
| 34 | |
| 34 | |
| 36 | |
| 60 | |
| 65 | |
| 67 | |
| 80 | |
| 75 | |
| 81 | |
| 68 | |
| 55 | |
| 59 | |
| 74 | |
| 70 | |
| 82 | |
| 66 | |
| 58 |
Keep exploring
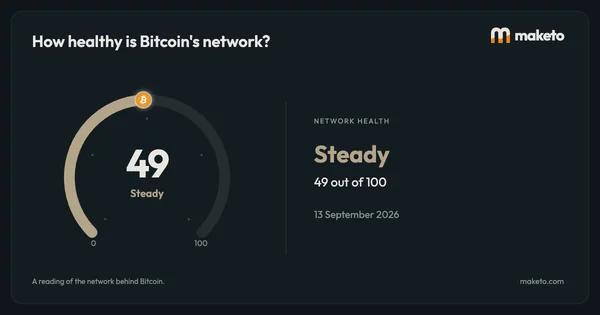
Source: Maketo blends six measures of Bitcoin's price against its own history into one score, once a day. It describes today, and it is not advice. Reading for .