

BITCOIN REALIZED PRICE BY WALLET SIZE
What did each size of holder pay?
Every group's average buy price, from the smallest wallets to the largest, with today's price for reference.
Bitcoin’s price against what each wallet size paid
Each coloured line is one size group's average buy price: what its coins cost the last time they moved. The white line is Bitcoin's daily close, with the live price as the dot at its end, and it is in every view: pick Price for the largest and the smallest group beside it, or pick a group to see it beside its next-smaller neighbour. A line only moves when that group's coins move, so a group that sat still through a long climb in the price keeps the line it had before.
+5 more in the tabs above
Inspect and compare dates
Pick two to four dates to read every group side by side.
| Wallet size | Change | Relative change | ||
|---|---|---|---|---|
| Bitcoin price | $77,842 | $83,463 | +$5,621 | +7.2% |
| 10,000+ BTC | $57,298 | $57,787 | +$489 | +0.9% |
| 1,000 to 10,000 BTC | $61,596 | $62,266 | +$670 | +1.1% |
| 100 to 1,000 BTC | $67,135 | $67,630 | +$494 | +0.7% |
| 10 to 100 BTC | $27,780 | $28,189 | +$409 | +1.5% |
| 1 to 10 BTC | $48,964 | $49,580 | +$616 | +1.3% |
| 0.1 to 1 BTC | $47,663 | $48,138 | +$475 | +1.0% |
| 0.01 to 0.1 BTC | $48,087 | $48,466 | +$378 | +0.8% |
Right now
The 100 to 1,000 BTC group paid the most for its Bitcoin, and the 10 to 100 BTC group paid the least.
The 100 to 1,000 BTC group's coins cost $67,630 on average, against $28,189 for the 10 to 100 BTC group. Bitcoin's close on was $83,463, above every one of the seven lines.
What every group paidevery group, 28 Sep 2026
| Size of holding | Average buy price | Share of all Bitcoin |
|---|---|---|
| 10,000+ BTC | $57,787 | 15.0% |
| 1,000 to 10,000 BTC | $62,266 | 20.7% |
| 100 to 1,000 BTC | $67,630 | 26.1% |
| 10 to 100 BTC | $28,189 | 21.0% |
| 1 to 10 BTC | $49,580 | 10.2% |
| 0.1 to 1 BTC | $48,138 | 5.3% |
| 0.01 to 0.1 BTC | $48,466 | 1.4% |
The share column measures each group against ALL the Bitcoin in circulation, not against these seven groups, so the column comes to a little under 100%. The missing slice is the addresses holding under 0.01 BTC, which are not one of the seven.
Why is the 10 to 100 BTC group’s average buy price so low? It holds most of the coins mined in 2009 and 2010 that have never moved. Those coins cost almost nothing, so they pull its average far below the groups beside it.
What changed
since a month agoEvery group's average is higher than it was on . The 10 to 100 BTC group moved furthest, from $27,780 to $28,189.
the spreadThe gap between the highest and lowest group averages is $39,441, against $39,356 a month before. That is much as it was.
Keep in mind
01An address is not a person. One holder can spread coins across many addresses, and an exchange can keep millions of customers’ coins in a few. Read every group as a set of addresses, never a headcount.
02An average moves when coins move. A group's average buy price is the price its coins last changed hands at, averaged across the group. It does not move because owners changed their minds: it moves when their coins do, so a group that sat still while the price climbed keeps the average it had before.
For you
A group's line is the level its coins cost. Where the price sits against that line is the group's own position, and the lines move slowly, so the picture changes with the price far more often than with the lines.
The spread is the part worth watching. Today it runs from 10 to 100 BTC at $28,189 up to 100 to 1,000 BTC at $67,630. When the lines bunch together near the price, a lot of holders are near their own break-even at once. This is a record of what was paid, not a call on what happens next.
Understanding
Bitcoin Realized Price by Wallet Size
Where it stands today
Of the seven wallet-size groups, the 100 to 1,000 BTC group paid the most for its coins, an average of $67,630 as of .
What does the chart show?
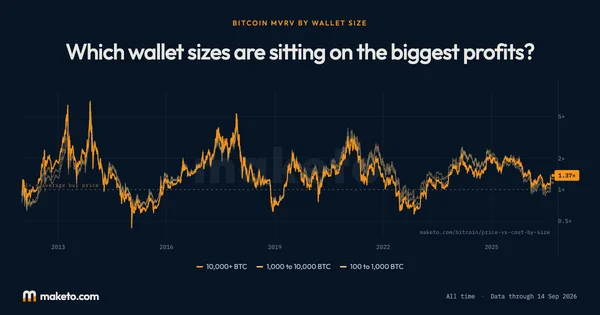
Sort every Bitcoin address by how much it holds, then work out the average price each group's coins last changed hands at. That is this page: seven size groups, one average buy price each, across the whole record, with Bitcoin's own daily close drawn beside them.
What is a realized price?
A group's average buy price is its realized price: the price at which each of the group's coins last moved, averaged together. It moves when coins move, not when opinions do. A group whose coins mostly sat still while the price climbed keeps the line it had; a group that has been buying recently has a line that climbs toward the current price.
What does the gap between the lines tell you?
While Bitcoin's close sits above every line, every size of holder is ahead on average; when it slips below one, that group is the first one behind. The lines themselves move slowly, because an average buy price moves only when coins move, so from one day to the next most of what changes is where the close sits against them.
What does the white line add?
The white line is Bitcoin's own daily close on the same dates. It is the one line that is not an average of anything: comparing it with a coloured line says whether that group's coins are worth more or less than they cost. The record here holds 5,385 days for each of the seven groups, from 2012.
How should you read it, and how not?
An address is not a person: one holder can spread coins across many addresses, and an exchange can hold millions of customers' coins in a few, so read each line as the average for a set of addresses rather than anyone's account. Read the lines as a record of what each group paid, not a forecast of what it will do.
The numbers
behind the chart
What does the current reading show?
Bitcoin price: the latest reading is $83,463, on . The highest reading since is $124,697 on ; the lowest is $4 on .
10,000+ BTC: the latest reading is $57,787, on . The highest reading since is $65,059 on ; the lowest is $5 on .
1,000 to 10,000 BTC: the latest reading is $62,266, on . The highest reading since is $66,156 on ; the lowest is $6 on .
100 to 1,000 BTC: the latest reading is $67,630, on . The highest reading since is $73,183 on ; the lowest is $6 on .
10 to 100 BTC: the latest reading is $28,189, on . The highest reading since is $29,541 on ; the lowest is $2 on .
1 to 10 BTC: the latest reading is $49,580, on . The highest reading since is $49,600 on ; the lowest is $8 on .
0.1 to 1 BTC: the latest reading is $48,138, on . The highest reading since is $48,299 on ; the lowest is $8 on .
0.01 to 0.1 BTC: the latest reading is $48,466, on . The highest reading since is $48,589 on ; the lowest is $6 on .
Every figure is one group's average buy price in US dollars, alongside Bitcoin's own daily close. The seven groups cover all but the addresses holding under 0.01 BTC.
What are the latest, highest and lowest readings?
| Measure | Latest | Highest | Lowest |
|---|---|---|---|
| Bitcoin price | $83,463 | $124,697 | $4 |
| 10,000+ BTC | $57,787 | $65,059 | $5 |
| 1,000 to 10,000 BTC | $62,266 | $66,156 | $6 |
| 100 to 1,000 BTC | $67,630 | $73,183 | $6 |
| 10 to 100 BTC | $28,189 | $29,541 | $2 |
| 1 to 10 BTC | $49,580 | $49,600 | $8 |
| 0.1 to 1 BTC | $48,138 | $48,299 | $8 |
| 0.01 to 0.1 BTC | $48,466 | $48,589 | $6 |
How do the readings compare with earlier dates?
| Reference date | Bitcoin price | 10,000+ BTC | 1,000 to 10,000 BTC | 100 to 1,000 BTC | 10 to 100 BTC | 1 to 10 BTC | 0.1 to 1 BTC | 0.01 to 0.1 BTC |
|---|---|---|---|---|---|---|---|---|
| 1 month ago | $77,842 | $57,298 | $61,596 | $67,135 | $27,780 | $48,964 | $47,663 | $48,087 |
| 3 months ago | $59,490 | $57,478 | $61,880 | $67,549 | $27,917 | $48,982 | $47,933 | $48,375 |
| 6 months ago | $66,345 | $58,823 | $63,128 | $69,345 | $28,042 | $48,997 | $47,884 | $48,290 |
| 1 year ago | $112,185 | $62,514 | $59,701 | $69,914 | $28,629 | $47,487 | $46,207 | $46,200 |
| 2 years ago | $65,858 | $42,454 | $35,442 | $35,502 | $17,798 | $30,924 | $31,124 | $31,966 |
What was the reading at each month’s end?
| Reading date | Bitcoin price | 10,000+ BTC | 1,000 to 10,000 BTC | 100 to 1,000 BTC | 10 to 100 BTC | 1 to 10 BTC | 0.1 to 1 BTC | 0.01 to 0.1 BTC |
|---|---|---|---|---|---|---|---|---|
| $78,571 | $57,326 | $61,595 | $67,159 | $27,818 | $49,023 | $47,703 | $48,122 | |
| $62,826 | $56,861 | $61,563 | $66,957 | $27,672 | $48,812 | $47,742 | $48,243 | |
| $58,532 | $57,502 | $61,641 | $67,352 | $27,865 | $48,950 | $47,926 | $48,379 | |
| $73,575 | $58,411 | $62,968 | $68,654 | $28,216 | $49,273 | $48,121 | $48,578 | |
| $76,327 | $58,389 | $62,963 | $69,108 | $28,087 | $49,100 | $47,951 | $48,436 | |
| $68,250 | $58,859 | $63,059 | $69,259 | $28,005 | $48,961 | $47,870 | $48,286 | |
| $66,971 | $59,539 | $63,695 | $69,748 | $28,134 | $49,117 | $47,942 | $48,315 | |
| $78,693 | $60,964 | $65,919 | $71,379 | $28,813 | $49,578 | $48,284 | $48,564 | |
| $87,568 | $62,852 | $65,500 | $72,048 | $28,592 | $49,296 | $47,979 | $48,230 | |
| $90,368 | $64,845 | $64,985 | $72,535 | $29,078 | $49,164 | $47,703 | $47,843 | |
| $109,580 | $64,347 | $62,443 | $72,984 | $29,483 | $48,915 | $47,424 | $47,610 | |
| $114,057 | $62,547 | $59,977 | $70,021 | $28,756 | $47,558 | $46,269 | $46,257 | |
| $108,248 | $63,045 | $58,513 | $67,687 | $28,105 | $46,545 | $45,403 | $45,556 | |
| $115,758 | $60,938 | $57,571 | $65,769 | $27,330 | $45,105 | $44,223 | $44,205 | |
| $107,160 | $55,236 | $54,064 | $61,989 | $26,188 | $43,241 | $42,448 | $42,502 | |
| $104,621 | $53,908 | $52,378 | $60,011 | $24,779 | $42,177 | $41,459 | $41,459 | |
| $94,177 | $52,338 | $50,145 | $56,080 | $23,947 | $40,861 | $40,052 | $40,242 | |
| $82,544 | $52,577 | $48,851 | $54,773 | $23,546 | $40,298 | $39,462 | $39,653 | |
| $84,330 | $52,484 | $48,102 | $54,714 | $23,377 | $39,671 | $38,918 | $39,163 | |
| $102,421 | $52,118 | $47,885 | $53,831 | $22,886 | $38,525 | $37,953 | $38,257 | |
| $93,479 | $51,621 | $45,799 | $51,134 | $21,499 | $36,692 | $36,289 | $36,455 | |
| $96,425 | $48,445 | $41,704 | $43,399 | $19,817 | $34,137 | $34,052 | $34,745 | |
| $70,262 | $43,475 | $37,173 | $37,371 | $18,301 | $31,597 | $31,769 | $32,520 | |
| $63,315 | $42,386 | $35,474 | $35,534 | $17,826 | $30,974 | $31,161 | $32,008 |
Source: Maketo’s wallet-size record. Reading for .