

BITCOIN EXCHANGE TRADING HOURS
When is the Bitcoin market busiest?
Which hours of the day the exchanges actually trade, and which half of the day, 00:00 to 12:00 or 12:00 to 24:00 UTC, carries the bigger moves.
Each hour of the UTC day at the exchanges
Bitcoin traded in each hour of the UTC day, last 91 days. 00:00 UTC, 93.9K BTC, 3.4% of the day. 01:00 UTC, 101.5K BTC, 3.7% of the day. 02:00 UTC, 99.6K BTC, 3.6% of the day. 03:00 UTC, 79.6K BTC, 2.9% of the day. 04:00 UTC, 77.9K BTC, 2.9% of the day. 05:00 UTC, 85.7K BTC, 3.1% of the day. 06:00 UTC, 78.7K BTC, 2.9% of the day. 07:00 UTC, 127.0K BTC, 4.6% of the day. 08:00 UTC, 122.7K BTC, 4.5% of the day. 09:00 UTC, 113.6K BTC, 4.2% of the day. 10:00 UTC, 81.5K BTC, 3.0% of the day. 11:00 UTC, 83.8K BTC, 3.1% of the day. 12:00 UTC, 141.4K BTC, 5.2% of the day. 13:00 UTC, 205.8K BTC, 7.5% of the day. 14:00 UTC, 233.5K BTC, 8.5% of the day. 15:00 UTC, 202.2K BTC, 7.4% of the day. 16:00 UTC, 144.4K BTC, 5.3% of the day. 17:00 UTC, 123.1K BTC, 4.5% of the day. 18:00 UTC, 115.1K BTC, 4.2% of the day. 19:00 UTC, 99.9K BTC, 3.7% of the day. 20:00 UTC, 79.3K BTC, 2.9% of the day. 21:00 UTC, 78.4K BTC, 2.9% of the day. 22:00 UTC, 83.3K BTC, 3.0% of the day. 23:00 UTC, 82.0K BTC, 3.0% of the day.
Use the left and right arrow keys to move through the hours of the day. Home and End jump to 00:00 and 23:00 UTC.
Each bar adds up the Bitcoin that changed hands in that hour of the UTC day at Binance, Bitstamp, Coinbase, Kraken and OKX, from 22 Jul 2026 to 20 Oct 2026. The dashed line is where every hour would sit if trading were spread evenly.
Inspect hours of the UTC day
Move through the day one hour at a time: the arrow keys step one hour, and Home and End jump to 00:00 and 23:00 UTC. The chart, its legend and the line below follow the hour you pick.
Busiest hour
The exchanges are busiest at 14:00 UTC.
That hour carries about 2.0 times the trading of an average hour, and the quietest, 04:00 UTC, about 0.7 times. If trading were spread evenly, every hour would carry one twenty-fourth of the day. Measured at Binance, Bitstamp, Coinbase, Kraken and OKX, from 22 Jul 2026 to 20 Oct 2026.
Every hour on record
Every hour on record puts the peak at 14:00 UTC, the same hour the last 91 days give.
That record starts on 19 Aug 2011 and adds up four exchanges rather than five: Kraken is not in it.
Which half of the day carries the trading
of Binance’s trading is in the west half (12:00 to 24:00 UTC)
of Coinbase’s is
between the two, trading the same coin
East is 00:00 to 12:00 UTC and west is 12:00 to 24:00 UTC. We name the hours rather than places, because an exchange’s computers tell you nothing about where its customers sit, and working hours in different places overlap.
The moves are a different kind of fact. How an exchange’s trading splits between the halves belongs to that exchange, and the splits differ by up to 13.5 points. Which half moves more belongs to Bitcoin: the average move from the start of an hour to its end is 0.212% in the east half (00:00 to 12:00 UTC) and 0.252% in the west half (12:00 to 24:00 UTC), and every exchange we record gives the same pair to two decimal places (0.21% and 0.25%), because they are all watching one price.
Do weekends look different
on an average weekday
on an average weekend day
on a weekend day than a weekday
These are dollars traded per day at the exchanges we record, averaged across 5,509 days from 18 Aug 2011, with Saturdays and Sundays counted by their UTC date.
Bitcoin itself never closes, so a weekend is not a market shutting: the same market simply sees less trading on those two days.
What this means for you
The hour matters more for a large order. The quietest hour, 04:00 UTC, carried about 33% of the trading of the busiest, 14:00 UTC, so the same order meets far less trading at one than at the other. And a quiet weekend is normal, not a warning: weekend days have been 42% quieter than weekdays since 2011.
Which exchange you use is a different question, and a smaller one: their prices sit close enough together that fees decide it.
Understanding
Bitcoin Exchange Trading Hours
Where it stands today
Bitcoin trading across the major exchanges is busiest at 14:00 UTC as of .
What does this page measure?
Bitcoin never closes, but it is not equally busy. Add up the trading at Binance, Bitstamp, Coinbase, Kraken and OKX hour by hour and a clear shape appears: over the last 91 days the busiest hour carried 2.0 times the trading of an average hour and the quietest 0.7 times. The page draws a second shape from every hour on record at Binance, Bitstamp, Coinbase and OKX, going back to 19 Aug 2011.
Why hours, and not places?
Everything here is in UTC, and the day is split into two halves: east, 00:00 to 12:00 UTC, and west, 12:00 to 24:00 UTC. That is deliberate. An exchange’s computers tell you nothing about where its customers are sitting, working hours in different places overlap, and a chart that named places would be inventing something the numbers do not contain. What the numbers do contain is the hour.
Why are the busy half and the moving half different facts?
How an exchange’s trading splits between the halves belongs to that exchange: over the last 91 days the west half (12:00 to 24:00 UTC) carried 67.8% of Coinbase’s trading and 54.3% of Binance’s, 13.5 points apart for two exchanges trading the same coin. Which half moves more belongs to Bitcoin: every exchange we record gives the same average move in each half to two decimal places, because there is only one price and they are all watching it.
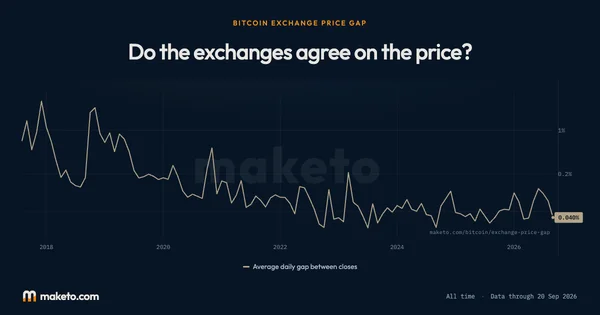
Do the exchanges agree on the price?
They do, closely enough that it is not a reason to pick one over another, and it is a question of its own rather than a footnote to this one. It has its own page, drawn from the same hourly record: how far apart their closing prices sit month by month, and why the biggest gap on it is not between exchanges at all. See the exchange price gap page.
The numbers
behind the chart
How much Bitcoin changed hands in each hour, last 91 days?
| Hour | Bitcoin traded | Share of the day | Compared with an average hour |
|---|---|---|---|
| 00:00 UTC | 93.9K BTC | 3.4% | 0.8× |
| 01:00 UTC | 101.5K BTC | 3.7% | 0.9× |
| 02:00 UTC | 99.6K BTC | 3.6% | 0.9× |
| 03:00 UTC | 79.6K BTC | 2.9% | 0.7× |
| 04:00 UTC | 77.9K BTC | 2.9% | 0.7× |
| 05:00 UTC | 85.7K BTC | 3.1% | 0.8× |
| 06:00 UTC | 78.7K BTC | 2.9% | 0.7× |
| 07:00 UTC | 127.0K BTC | 4.6% | 1.1× |
| 08:00 UTC | 122.7K BTC | 4.5% | 1.1× |
| 09:00 UTC | 113.6K BTC | 4.2% | 1.0× |
| 10:00 UTC | 81.5K BTC | 3.0% | 0.7× |
| 11:00 UTC | 83.8K BTC | 3.1% | 0.7× |
| 12:00 UTC | 141.4K BTC | 5.2% | 1.2× |
| 13:00 UTC | 205.8K BTC | 7.5% | 1.8× |
| 14:00 UTC | 233.5K BTC | 8.5% | 2.0× |
| 15:00 UTC | 202.2K BTC | 7.4% | 1.8× |
| 16:00 UTC | 144.4K BTC | 5.3% | 1.3× |
| 17:00 UTC | 123.1K BTC | 4.5% | 1.1× |
| 18:00 UTC | 115.1K BTC | 4.2% | 1.0× |
| 19:00 UTC | 99.9K BTC | 3.7% | 0.9× |
| 20:00 UTC | 79.3K BTC | 2.9% | 0.7× |
| 21:00 UTC | 78.4K BTC | 2.9% | 0.7× |
| 22:00 UTC | 83.3K BTC | 3.0% | 0.7× |
| 23:00 UTC | 82.0K BTC | 3.0% | 0.7× |
How far did the price move in each hour?
| Hour | Average move | Compared with an average hour |
|---|---|---|
| 00:00 UTC | 0.218% | 0.9× |
| 01:00 UTC | 0.251% | 1.1× |
| 02:00 UTC | 0.234% | 1.0× |
| 03:00 UTC | 0.185% | 0.8× |
| 04:00 UTC | 0.186% | 0.8× |
| 05:00 UTC | 0.201% | 0.9× |
| 06:00 UTC | 0.176% | 0.8× |
| 07:00 UTC | 0.191% | 0.8× |
| 08:00 UTC | 0.319% | 1.4× |
| 09:00 UTC | 0.235% | 1.0× |
| 10:00 UTC | 0.159% | 0.7× |
| 11:00 UTC | 0.183% | 0.8× |
| 12:00 UTC | 0.301% | 1.3× |
| 13:00 UTC | 0.329% | 1.4× |
| 14:00 UTC | 0.474% | 2.0× |
| 15:00 UTC | 0.392% | 1.7× |
| 16:00 UTC | 0.194% | 0.8× |
| 17:00 UTC | 0.217% | 0.9× |
| 18:00 UTC | 0.206% | 0.9× |
| 19:00 UTC | 0.185% | 0.8× |
| 20:00 UTC | 0.155% | 0.7× |
| 21:00 UTC | 0.196% | 0.8× |
| 22:00 UTC | 0.210% | 0.9× |
| 23:00 UTC | 0.170% | 0.7× |
How much Bitcoin has changed hands in each hour, every hour on record?
| Hour | Bitcoin traded | Share of the day | Compared with an average hour |
|---|---|---|---|
| 00:00 UTC | 14.55M BTC | 4.2% | 1.0× |
| 01:00 UTC | 13.16M BTC | 3.8% | 0.9× |
| 02:00 UTC | 12.33M BTC | 3.6% | 0.9× |
| 03:00 UTC | 11.53M BTC | 3.3% | 0.8× |
| 04:00 UTC | 11.15M BTC | 3.2% | 0.8× |
| 05:00 UTC | 11.03M BTC | 3.2% | 0.8× |
| 06:00 UTC | 11.58M BTC | 3.4% | 0.8× |
| 07:00 UTC | 12.70M BTC | 3.7% | 0.9× |
| 08:00 UTC | 13.38M BTC | 3.9% | 0.9× |
| 09:00 UTC | 12.90M BTC | 3.7% | 0.9× |
| 10:00 UTC | 13.40M BTC | 3.9% | 0.9× |
| 11:00 UTC | 13.43M BTC | 3.9% | 0.9× |
| 12:00 UTC | 16.30M BTC | 4.7% | 1.1× |
| 13:00 UTC | 18.61M BTC | 5.4% | 1.3× |
| 14:00 UTC | 20.85M BTC | 6.0% | 1.5× |
| 15:00 UTC | 20.19M BTC | 5.9% | 1.4× |
| 16:00 UTC | 19.42M BTC | 5.6% | 1.4× |
| 17:00 UTC | 16.46M BTC | 4.8% | 1.1× |
| 18:00 UTC | 15.49M BTC | 4.5% | 1.1× |
| 19:00 UTC | 15.10M BTC | 4.4% | 1.1× |
| 20:00 UTC | 14.72M BTC | 4.3% | 1.0× |
| 21:00 UTC | 11.97M BTC | 3.5% | 0.8× |
| 22:00 UTC | 12.09M BTC | 3.5% | 0.8× |
| 23:00 UTC | 12.46M BTC | 3.6% | 0.9× |
What is included in this reading?
The hours chart and the reading above it add up hourly trading at Binance, Bitstamp, Coinbase, Kraken and OKX, from 22 Jul 2026 to 20 Oct 2026. Hours are UTC.
Every hour on record adds up Binance, Bitstamp, Coinbase and OKX from 19 Aug 2011; Kraken is not in it.
The weekday and weekend averages are dollars traded per day from 18 Aug 2011 to 19 Oct 2026.
Source: Maketo’s hourly record of trading at the exchanges it follows. Reading for .