

Canary HBAR ETF (HBR) Flows
Is money moving into HBR or out?
The money added to HBR or taken out of it each trading day.
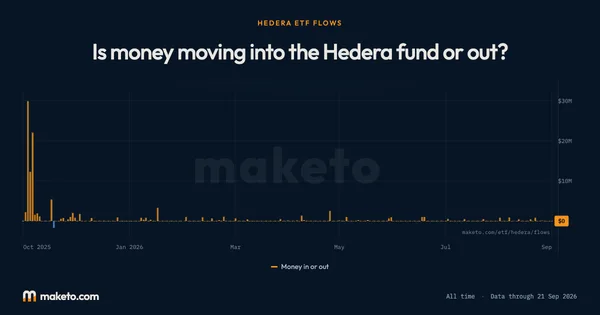
Money in or out of HBR, each trading day
Each bar is one trading day. An orange bar is a day more money came into HBR than left, a blue bar a day more left than came in. The biggest day for money coming in was $30 million, on 30 Oct 2025. The biggest day for money leaving was $1.7 million, on 14 Nov 2025. 2 trading days in the record have no figure from the fund, so they have no bar.
Inspect and compare dates
Pick two dates to compare the money moving through HBR on each.
| Measure | Change | ||
|---|---|---|---|
| Money in or out | $0 | $0 | +$0 |
RIGHT NOW
Over the past month, more money has come into HBR than has left. Buying
How much money has moved lately?
Last trading day
Flat
Past week
Money in
Past month
Money in
2 days out, 3 days in
Is that fast or slow, for this fund?
How much money has gone into HBR
Total money in
Everything invested in this fund since October 2025.
How much of HBR changes hands
Changed hands
What was bought and sold on 6 Nov 2026. Trading is not the same as money arriving.
What this means for you
More money is coming into HBR than leaving.
Over the past month a net $2.5 million has flowed into HBR. That's steady, unspectacular demand.
Each dollar in means the fund buys real Hedera. Quiet, consistent buying like this is how a fund builds its pile in the first place.
Watch whether it builds into a heavier pace or fades back to balanced. With one US Hedera fund, this run is the whole US fund read.
What to watch from here
- A net $2.5 million came into HBR this past month. That's steady demand.
- Whether the buying builds or fades back to balanced.
- With one US Hedera fund, this run is the whole US fund read.
Understanding
Canary HBAR ETF (HBR) Flows
Where it stands today
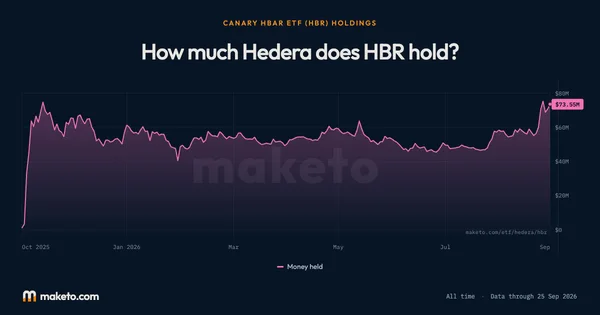
Canary HBAR ETF (HBR) has taken in $117 million since it launched as of .
$298 thousand worth of Canary HBAR ETF (HBR) changed hands as of .
Money in and out is the dollars people put into HBR or took out of it. When more people buy new shares than cash theirs in, the fund takes in money and buys Hedera with it. When more cash out, it pays them, and gives up coins to do it.
The Each day tab is one bar per trading day: orange when more money came in than went out, blue when more went out. The Running total adds every day up since October 2025, so it climbs while money arrives and falls while it leaves.
The reading at the top of this page judges the past month against HBR's own history, so a fund that usually moves a little and one that usually moves a lot are each measured by their own yardstick.
The numbers
behind the chart
What does the current reading show?
Money in or out: the latest reading is $0, on . The highest reading since is +$30M on ; the lowest is −$1.7M on .
The money that went into or out of HBR on each trading day: the highest reading is the biggest day money came in, and the lowest the biggest day it left. A day the fund did not report has no figure.
What are the latest, highest and lowest readings?
| Measure | Latest | Highest | Lowest |
|---|---|---|---|
| Money in or out | $0 | +$30M | −$1.7M |
How do the readings compare with earlier dates?
| Reference date | Money in or out |
|---|---|
| 1 month ago | $0 |
| 3 months ago | $0 |
| 6 months ago | +$2.5M |
| 1 year ago | +$1.1M |
What was the reading at each month’s end?
| Reading date | Money in or out |
|---|---|
| $0 | |
| $0 | |
| +$399K | |
| $0 | |
| $0 | |
| +$250K | |
| $0 | |
| $0 | |
| +$272K | |
| $0 | |
| $0 | |
| +$798K | |
| +$12M |

Source: Money in and out is the fund's own daily record, read once a day. Reading for .