

Invesco Galaxy Solana ETF (QSOL) Realized Profit and Loss
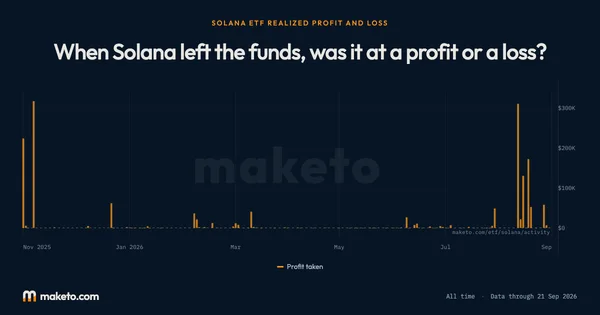
When coins left QSOL, was it at a profit or a loss?
Coins leave a fund when people cash out. This is what those coins had gained or lost.
Profit taken as coins left QSOL, each day
Dollars locked in each day by coins leaving QSOL above what they cost. A day with no bar has no figure. Estimates. No fund publishes what it paid. This is worked out from the money going in and the price on the day it arrived, so treat it as close rather than exact.
Inspect and compare dates
Pick two dates to compare what coins leaving QSOL locked in on each day.
| Measure | Change | ||
|---|---|---|---|
| Profit taken | $0 | $5.06K | +$5.06K |
Right now
Gains and losses came out about even: coins leaving QSOL over the past month locked in about $0 of profit and $0 of losses.
What left QSOL over the past month?
The 30 days to Sep 23, 2026.
Profit taken
Locked in by coins leaving above what they cost.
Losses
Given up by coins leaving below what they cost.
Coins moved
Coins that left. Leaving is not always selling.
About 0 SOL left QSOL over those 30 days.
How much of this can we see?
We can see a buy price for 79% of the coins QSOL holds.
Understanding
Invesco Galaxy Solana ETF (QSOL) Realized Profit and Loss
Where it stands today
Over the past month, coins leaving Invesco Galaxy Solana ETF (QSOL) locked in about $0 of profit and $0 of losses as of .
About 0 SOL left Invesco Galaxy Solana ETF (QSOL) over the past month as of .
Coins leave a fund when people cash out their shares: the fund gives up coins to pay them. Each coin that leaves has either gained or lost against what QSOL paid for it. Realized profit is the gain locked in when a coin leaves above its cost, and realized loss is the loss locked in when it leaves below.
The Coins moved tab counts the Solana that left QSOL each day, in SOL. Leaving is not always selling on the open market, so read it as coins going out of the fund rather than coins sold.
A month with more losses than profit means the coins going out, taken together, had been bought at a higher price than the day they left. It says what happened to the coins that left, not what the fund still holds: that is the What it paid page.
The numbers
behind the chart
What does the current reading show?
Profit taken: the latest reading is $5 thousand, on . The highest reading since is $5 thousand on ; the lowest is $0 on .
Losses: the latest reading is $14 thousand, on . The highest reading since is $89 thousand on ; the lowest is $14 thousand on .
Coins moved: the latest reading is 4,859 SOL, on . The highest reading since is 12,066 SOL on ; the lowest is 4,045 SOL on .
What coins leaving QSOL locked in each day, as profit or as losses, and how many Solana left. A day with no figure is left out.
What are the latest, highest and lowest readings?
| Measure | Latest | Highest | Lowest |
|---|---|---|---|
| Profit taken | $5 thousand | $5 thousand | $0 |
| Losses | $14 thousand | $89 thousand | $14 thousand |
| Coins moved | 4,859 SOL | 12,066 SOL | 4,045 SOL |
How do the readings compare with earlier dates?
| Reference date | Profit taken | Losses | Coins moved |
|---|---|---|---|
| 1 month ago | No reading | No reading | No reading |
| 3 months ago | No reading | No reading | No reading |
What was the reading at each month’s end?
| Reading date | Profit taken | Losses | Coins moved |
|---|---|---|---|
| No reading | No reading | No reading | |
| No reading | No reading | No reading | |
| No reading | No reading | No reading |
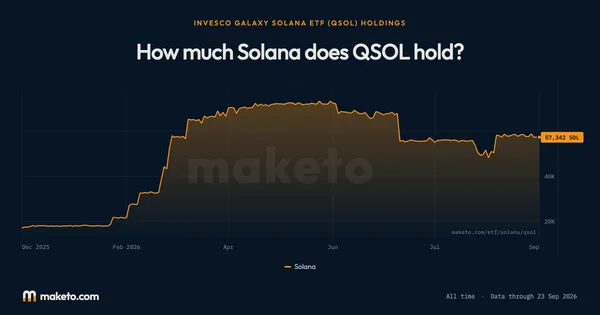
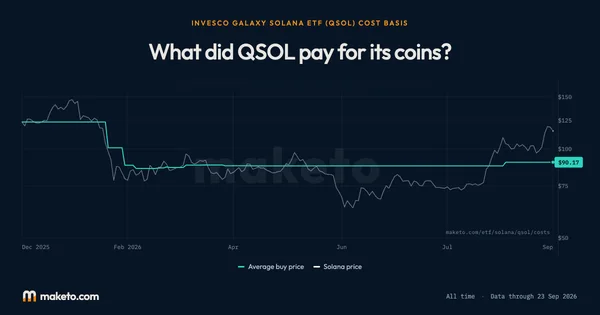

Source: The money going into and out of QSOL each trading day, and Solana's price. No fund publishes what it paid. This is worked out from the money going in and the price on the day it arrived, so treat it as close rather than exact. Reading for .