

21Shares Solana ETF (TSOL) Flows
Is money moving into TSOL or out?
The money added to TSOL or taken out of it each trading day.
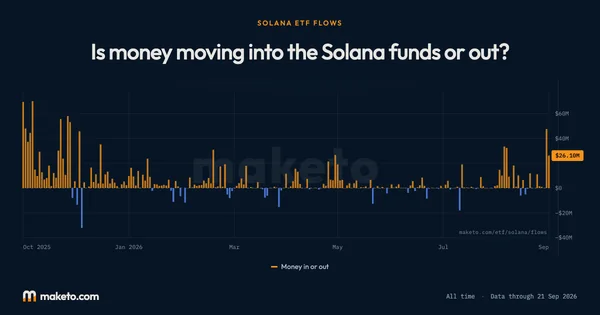
Money in or out of TSOL, each trading day
Each bar is one trading day. An orange bar is a day more money came into TSOL than left, a blue bar a day more left than came in. The biggest day for money coming in was $6.0 million, on 21 Nov 2025. The biggest day for money leaving was $42 million, on 3 Dec 2025. One trading day in the record has no figure from the fund, so it has no bar.
Inspect and compare dates
Pick two dates to compare the money moving through TSOL on each.
| Measure | Change | ||
|---|---|---|---|
| Money in or out | $0 | $0 | +$0 |
RIGHT NOW
Over the past month, the money going into and out of TSOL has roughly balanced out. Wait and See
How much money has moved lately?
Last trading day
Flat
Past week
Flat
Past month
Flat
No days in or out
Is that fast or slow, for this fund?
How much money has gone into TSOL, next to the other funds
Total money in
Below zero. Since November 2025, more money has left this fund than entered it.
Share of money in
More money has left than arrived, so this fund holds no share of the money that flowed in.
All funds, past month
Money left
How much of TSOL changes hands
Changed hands
What was bought and sold on 6 Nov 2026. Trading is not the same as money arriving.
TSOL's $31K was under 1% of the trading across the Solana funds that day, so this fund changes hands far less than the rest of the group.
What this means for you
Money in and out of TSOL is roughly balanced.
Over the past month the money coming in and going out have roughly cancelled out (nothing either way). Neither side is winning.
That's a common state for a single fund. Most days, most funds just tick along while one or two of the big ones do the moving.
Watch which way it tips over the coming weeks, and check the all-funds page for the group-wide picture. One quiet fund says little on its own.
What to watch from here
- Money in and out roughly cancelled out this past month (nothing either way).
- Which way it tips over the coming weeks.
- The all-funds page carries the group-wide read.
Understanding
21Shares Solana ETF (TSOL) Flows
Where it stands today
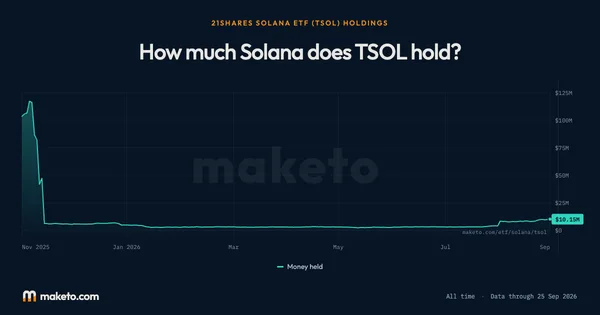
21Shares Solana ETF (TSOL) has paid out $98 million more than it has taken in since it launched as of .
$31 thousand worth of 21Shares Solana ETF (TSOL) changed hands as of .
Money in and out is the dollars people put into TSOL or took out of it. When more people buy new shares than cash theirs in, the fund takes in money and buys Solana with it. When more cash out, it pays them, and gives up coins to do it.
The Each day tab is one bar per trading day: orange when more money came in than went out, blue when more went out. The Running total adds every day up since November 2025, so it climbs while money arrives and falls while it leaves.
The reading at the top of this page judges the past month against TSOL's own history, so a fund that usually moves a little and one that usually moves a lot are each measured by their own yardstick.
The numbers
behind the chart
What does the current reading show?
Money in or out: the latest reading is $0, on . The highest reading since is +$6.0M on ; the lowest is −$42M on .
The money that went into or out of TSOL on each trading day: the highest reading is the biggest day money came in, and the lowest the biggest day it left. A day the fund did not report has no figure.
What are the latest, highest and lowest readings?
| Measure | Latest | Highest | Lowest |
|---|---|---|---|
| Money in or out | $0 | +$6.0M | −$42M |
How do the readings compare with earlier dates?
| Reference date | Money in or out |
|---|---|
| 1 month ago | $0 |
| 3 months ago | $0 |
| 6 months ago | $0 |
What was the reading at each month’s end?
| Reading date | Money in or out |
|---|---|
| $0 | |
| $0 | |
| $0 | |
| $0 | |
| $0 | |
| $0 | |
| $0 | |
| $0 | |
| $0 | |
| $0 | |
| $0 | |
| −$1.4M |

Source: Money in and out is the fund's own daily record, read once a day. Reading for .