

XRP ETF Flows
Is money moving into the XRP funds or out?
The money added to the XRP funds or taken out of them each trading day.
Money in and out of the XRP funds, each trading day
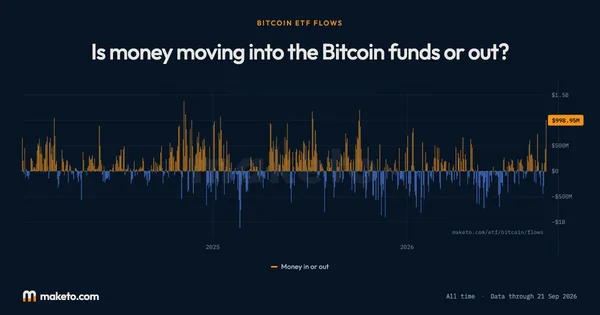
Each bar is one trading day. An orange bar is a day more money came into the funds than left, a blue bar a day more left than came in. The biggest day for money coming in was $243 million, on Nov 14, 2025. The biggest day for money leaving was $93 million, on Jan 29, 2026. Three trading days have no bar, because the funds did not fully report. A blank day is not a zero.
Inspect and compare dates
Pick two dates to compare the money that went into or out of the XRP funds on each day, and the running total by then.
| Measure | Change | ||
|---|---|---|---|
| Money in or out | $18.38M | $20.02M | +$1.64M |
Right now
Over the past month, money has come into the XRP ETFs far faster than usual. Buying Heavily
A strong sign of demand. Heavy buying from the funds puts real, steady pressure under the price of XRP.
The funds have taken in money 2 trading days in a row.
How much money has moved lately?
As of Sep 23, 2026.
Last trading day
Money in
Two of the five funds took money in. Three did not move.
Past week
Money in
Past month
Money in
3 days out, 14 days in
Is money flow fast or slow, by these funds' standards?
Which funds is the money going into?
| Fund | Past month | Share of all money in |
|---|---|---|
| XRPBitwise XRP ETF | +$98M | 36.4% |
| XRPZFranklin XRP ETF | +$54M | 27.7% |
| XRPCCanary XRP ETF | +$20M | 27.6% |
| GXRPGrayscale XRP Trust | +$12M | 8.3% |
| TOXR21Shares XRP ETF | −$1.1M | More out than in |
Share of all the money that has flowed into the XRP ETFs since 2025. A fund that has had more money leave than arrive shows "More out than in".
Which funds moved money, day by day?
| Day | XRP | XRPZ | XRPC | GXRP | TOXR | All funds |
|---|---|---|---|---|---|---|
| +$12M | +$6.5M | $0 | $0 | $0 | +$18M | |
| +$19M | +$862K | $0 | $0 | $0 | +$20M | |
| $0 | $0 | $0 | $0 | $0 | $0 | |
| −$1.6M | +$1.5M | $0 | $0 | $0 | −$44K | |
| $0 | $0 | −$1.4M | $0 | −$3.8M | −$5.2M | |
| $0 | +$3.5M | $0 | $0 | $0 | +$3.5M | |
| $0 | $0 | $0 | $0 | $0 | $0 | |
| +$11M | $0 | $0 | $0 | $0 | +$11M | |
| $0 | $0 | $0 | $0 | $0 | $0 | |
| $0 | +$5.1M | $0 | $0 | $0 | +$5.1M | |
| +$9.3M | $0 | $0 | +$3.0M | $0 | +$12M | |
| $0 | +$1.5M | $0 | $0 | $0 | +$1.5M | |
| $0 | $0 | $0 | $0 | $0 | $0 | |
| +$3.0M | +$3.2M | $0 | $0 | $0 | +$6.1M | |
| −$7.2M | $0 | $0 | $0 | $0 | −$7.2M | |
| $0 | +$6.6M | +$3.0M | +$4.7M | $0 | +$14M | |
| +$930K | $0 | +$4.7M | $0 | $0 | +$5.6M | |
| +$15M | +$3.0M | +$5.1M | $0 | +$2.7M | +$26M | |
| +$12M | +$6.3M | $0 | $0 | $0 | +$18M | |
| +$13M | +$9.0M | +$6.0M | $0 | $0 | +$28M | |
| +$11M | +$6.4M | +$2.2M | +$4.3M | $0 | +$24M | |
| +$8.2M | +$4.0M | +$1.6M | $0 | $0 | +$14M | |
| +$17M | +$1.5M | $0 | $0 | $0 | +$18M | |
| +$9.9M | +$3.3M | $0 | $0 | $0 | +$13M | |
| +$1.2M | +$1.2M | $0 | $0 | $0 | +$2.4M | |
| +$2.2M | +$1.6M | $0 | +$1.9M | $0 | +$5.8M | |
| $0 | $0 | $0 | $0 | $0 | $0 | |
| $0 | $0 | $0 | $0 | $0 | $0 | |
| +$2.3M | $0 | $0 | $0 | $0 | +$2.3M | |
| $0 | $0 | $0 | $0 | $0 | $0 |
maketo.com/etf/xrp/flows
What does this mean for you?
Money is pouring into the XRP ETFs, faster than usual.
Over the past month about $182 million has moved into the US XRP funds, arriving on 14 separate days. That's a heavier pace of buying than 76% of this group's history.
Every dollar that lands in one of these funds sends it out to buy real XRP on the open market, so a month like this puts direct, steady pressure under the price. Since 2025 the funds have taken in $1.75 billion.
A run this heavy usually means brokerage customers are putting real money in, through advisors, retirement accounts and trading apps, rather than one desk making a single large move. The thing to watch is whether the pace holds or starts to cool.
What to watch from here
- Heavy buying. About $182 million went into the XRP funds over the past month, on 14 separate days.
- That's a faster pace than 76% of this group's history.
- Watch whether the pace holds or starts to cool. That's the first sign the buying is fading.
Understanding
XRP ETF Flows
Where it stands today
The XRP ETFs have taken in $1.75 billion since 2025 as of .
Over the past month a net $182 million flowed into the XRP ETFs as of .
XRP ETFs are stock-market products that hold real XRP on your behalf. You buy a share through a normal brokerage account and the fund owns the coins for you. The US XRP funds have been trading since 2025, and they're one of the clearest windows onto what bigger buyers are doing. When money goes into one, the fund goes out and buys real XRP. When money leaves, it sells.
The number this page leads with is simple: how much money moved into or out of all the US XRP funds, added up. A single day rarely tells the story. What matters is which side is consistently larger over a week or a month. A steady run of money coming in means demand from bigger buyers is holding up. A steady run going out means they're trimming, and it's worth watching even when the amounts look small.
The percentages on this page compare today against this group's own record since 2025, never against another coin's funds. A “faster than usual” reading means busy for these funds, not busy in absolute terms. The shorter that record is, the more a big percentage is a nudge rather than a verdict.
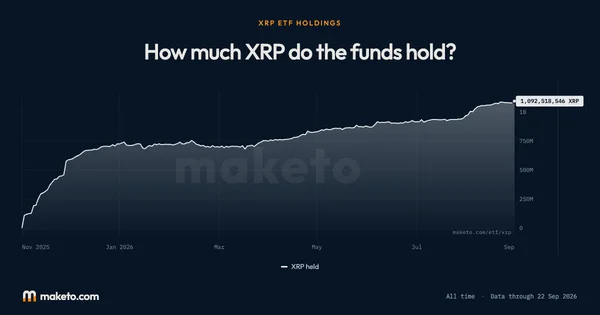
The Each day tab shows one bar per trading day: orange when more money came into the funds than left, blue when more left than came in. The Running total tab adds every day up since November 2025, which is why one rough month can barely show on it.
These funds trade on the stock market, so there are no figures for weekends or market holidays. A trading day the funds did not fully report is left blank on both tabs, never drawn as a zero.
The numbers
behind the chart
What does the current reading show?
Money in, running total: the latest reading is +$1.7B, on . The highest reading since is +$1.7B on ; the lowest is $0 on .
Every dollar in and out of the funds, added up day by day. A day the funds did not fully report has no figure.
What are the latest, highest and lowest readings?
| Measure | Latest | Highest | Lowest |
|---|---|---|---|
| Money in, running total | +$1.7B | +$1.7B | $0 |
How do the readings compare with earlier dates?
| Reference date | Money in, running total |
|---|---|
| 1 month ago | +$1.6B |
| 3 months ago | +$1.5B |
| 6 months ago | +$1.2B |
What was the reading at each month’s end?
| Reading date | Money in, running total |
|---|---|
| +$1.7B | |
| +$1.5B | |
| +$1.5B | |
| +$1.4B | |
| +$1.3B | |
| +$1.2B | |
| +$1.2B | |
| +$1.2B | |
| +$1.2B | |
| +$667M |

Source: The figures the XRP funds report each trading day. Reading for .