

BITCOIN ACCUMULATION/DISTRIBUTION
Do busy candles finish near their highs or lows?
Rising, at 23,007,957. As of Oct 20, 2026.
Bitcoin Accumulation/Distribution
Daily candles
1D candles. Last closed candle: 2026-10-20 00:00:00 UTC.
Drag to zoom, shift and drag to pan. Click the chart before scrolling to zoom with the wheel, and press Escape to let the page scroll again. The candle interval changes the calculation; the range buttons change only the dates on screen.
The Accumulation/Distribution line weights each candle’s volume by where its close sits inside the high-low range. The name describes a formula, not identified purchases or sales. Pick a candle interval and the chart recalculates.
Change the calculation
The last twelve readings as a table
| Candle start, UTC | Accumulation/distribution line |
|---|---|
| 2026-08-08 00:00:00 UTC | 22,857,691.12 BTC |
| 2026-08-15 00:00:00 UTC | 22,802,014.05 BTC |
| 2026-08-22 00:00:00 UTC | 22,990,497.5 BTC |
| 2026-08-30 00:00:00 UTC | 23,018,768.92 BTC |
| 2026-09-06 00:00:00 UTC | 23,059,266.51 BTC |
| 2026-09-13 00:00:00 UTC | 22,982,389.92 BTC |
| 2026-09-20 00:00:00 UTC | 23,015,864.57 BTC |
| 2026-09-27 00:00:00 UTC | 23,079,195.73 BTC |
| 2026-10-05 00:00:00 UTC | 23,042,102.76 BTC |
| 2026-10-12 00:00:00 UTC | 22,984,482.11 BTC |
| 2026-10-19 00:00:00 UTC | 22,990,086.69 BTC |
| 2026-10-20 00:00:00 UTC | 23,007,957.29 BTC |
Quote this chart
The image is of the chart as you have it. The link is to the page, which opens on the published reading, so the sentence above is what tells a reader which interval and formula the quotation was taken on.
Maketo. Bitcoin Accumulation/Distribution (adl), 1D candles, Maketo combined market. Last closed candle: 2026-10-20 00:00:00 UTC. Calculation version 1.0.0. https://maketo.com/technical-indicators/accumulation-distribution
Source: <a href="https://maketo.com/technical-indicators/accumulation-distribution">Maketo Bitcoin Accumulation/Distribution</a>
RIGHT NOW
Rising, at 23,007,957. As of Oct 20, 2026.
What the day shows
At the 2026-10-20 UTC close, the reading was 2.3008e+07. The previous available reading was 2.29901e+07. This adds or subtracts traded Bitcoin according to where each day closes inside its range.
How to read that number
A rising line means volume has tended to occur in candles closing higher in their ranges. The oscillator describes changes in that cumulative path.
What it was read at
Accumulation/distribution line, on daily candles. Change the interval or the settings on the chart above and every number there is recalculated in your browser. This sentence keeps the daily reading the page is published on.
Understanding
Bitcoin Accumulation/Distribution
Where it stands today
Accumulation/Distribution: rising, at 23,007,957 as of .
What is Bitcoin Accumulation/Distribution?
The Accumulation/Distribution Line combines each candle’s trading volume with where that candle closed inside its own range. A close near the high adds a positive amount; a close near the low adds a negative amount. The running line keeps those weighted amounts over time. Its technical name does not mean the page measures coins entering wallets, exchanges, or investment funds.The candle multiplier is (2 × close − low − high) ÷ (high − low). It is +1 at the high, −1 at the low, and 0 halfway between them. Multiplying it by volume in BTC gives a weighted Bitcoin amount. Maketo adds those amounts to create the line. If a candle’s high equals its low, its contribution is set to zero because there is no range within which to place the close.The Chaikin Oscillator is a related view on this page. It subtracts a slower exponential average of the running line from a faster one, using 3 and 10 candles by default. The running line describes the accumulated history; the oscillator describes the separation between two smoothed versions of that history. Neither calculation identifies the side that initiated individual trades.
A rising line reflects closes within their ranges
More positive weighted volume has been added over the period you are examining. That can result from more volume, closes nearer the highs, or both. Maketo’s default direction compares the line with its value five candles earlier. Its position above or below zero is not the directional rule.
Price and the line can move in different directions
A candle may close below the preceding close while finishing near its own high. This adds a positive contribution even though the close-to-close price change was negative. Before describing a disagreement as unusual, check whether the two calculations are simply asking different questions.
The oscillator has a different zero line
A positive Chaikin Oscillator means the faster average of the running line is above the slower average. A negative value means it is below. Zero has a useful meaning for that difference. Zero on the running line instead depends on where the cumulative history began.
How Accumulation/Distribution is calculated
The close-location multiplier is ((close − low) − (high − close)) / (high − low). Multiply by volume and add over time. Chaikin subtracts the line’s 10-period EMA from its 3-period EMA. The page is published on Accumulation/distribution line. A period counts candles at the interval you choose, so the same setting covers a different stretch of time on a one-hour chart than on a daily one. How smoothing and missing candles are handled.
A calculation you can follow
Consider two illustrative candles. Prices are in dollars and volume is in BTC; these are arithmetic examples rather than dated market observations. The first candle has a $100,000 low, a $110,000 high, a $108,000 close, and 100 BTC of volume. Its multiplier is (216,000 − 100,000 − 110,000) ÷ 10,000 = 0.6.That candle adds 0.6 × 100 = 60 weighted BTC to the line.The next candle has a $102,000 low, a $108,000 high, a $103,000 close, and 90 BTC of volume. Its multiplier is −4,000 ÷ 6,000, or about −0.667. It subtracts 60 weighted BTC.The two contributions cancel. The line returns to its starting level despite 190 BTC of trading across the two candles. If a prior close had been $109,000, the first candle would still add 60 even though its $108,000 close was lower.The line weights volume by closing position. A flat net result does not mean no trading occurred, and a positive contribution does not establish a positive close-to-close return.
Running total versus oscillator periods
The basic line has no rolling period that discards older contributions. The 3- and 10-candle settings belong to the Chaikin Oscillator’s averages. Shorter settings react sooner; longer settings retain more influence from previous values.
Interval and starting history
Combining candles changes their highs, lows, and closing positions. A daily calculation therefore need not equal the sum of all the corresponding hourly contributions. A different starting history also shifts the line’s absolute level. Missing required history is shown as a gap rather than treated as zero volume.
Weighted BTC is not buyer-initiated BTC
A positive multiplier is inferred from the candle’s shape. It does not inspect trade direction. Calling the result actual buying volume would give the formula information it does not contain.
The line’s level is not a balance sheet
The running amount can be negative, and the same coins can be traded repeatedly. It is neither the number of Bitcoin held by a group nor a measure of fresh money entering the market.
Accumulation/Distribution compared with Chaikin Money Flow
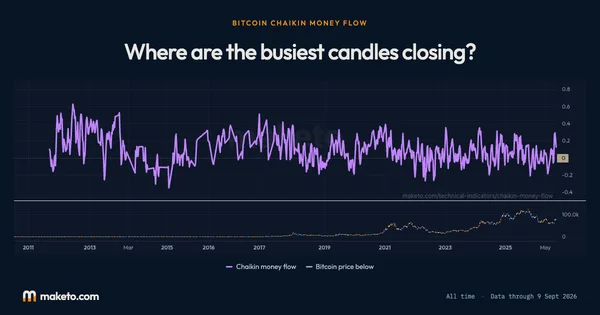
Chaikin Money Flow uses the same candle multiplier but divides a rolling sum of weighted volume by total volume in that window. It produces a ratio with a fixed lookback rather than a running line whose level depends on earlier history. Open Bitcoin Chaikin Money Flow.
Does a close exactly halfway through the candle contribute anything?
No. Its multiplier is zero, so its contribution to the running line is zero even if trading volume was large. It still represents real activity; this particular weighting assigns it no direction.
Why does another chart show a different absolute line value?
Starting history, candle boundaries, and the covered market can all differ. An added starting offset changes the line’s level without changing its subsequent increments. Compare the same settings and overlapping changes before comparing raw levels.
The numbers
behind the chart
What does the current reading show?
Bitcoin price: the latest reading is $82,946, on . The highest reading since is $123,334 on ; the lowest is $0.0495 on .
Accumulation/distribution line: the latest reading is 23,007,957, on . The highest reading since is 23,094,328 on ; the lowest is −118,320 on .
Readings since Jul 17, 2010 let you compare Oct 20, 2026 with earlier months. Highest and lowest cover every reading shown; month-end values use the last reading on or before that date. Every figure here is the published daily reading at Accumulation/distribution line, beside Bitcoin's own close on the same day. Change the interval or the settings on the chart above and the chart is recalculated in your browser, but this record is not. How Maketo measures the Bitcoin price.
What are the latest, highest and lowest readings?
| Measure | Latest | Highest | Lowest |
|---|---|---|---|
| Bitcoin price | $82,946 | $123,334 | $0.0495 |
| Accumulation/distribution line | 23,007,957 | 23,094,328 | −118,320 |
How do the readings compare with earlier dates?
| Reference date | Bitcoin price | Accumulation/distribution line |
|---|---|---|
| 1 month ago | $81,164 | 23,015,865 |
| 3 months ago | $63,907 | 22,803,539 |
| 6 months ago | $74,815 | 22,836,091 |
| 1 year ago | $106,447 | 23,052,244 |
| 2 years ago | $67,067 | 21,423,196 |
What was the reading at each month’s end?
| Reading date | Bitcoin price | Accumulation/distribution line |
|---|---|---|
| $84,462 | 23,079,196 | |
| $77,682 | 23,018,769 | |
| $64,313 | 22,834,724 | |
| $60,019 | 22,748,449 | |
| $73,519 | 22,843,705 | |
| $75,766 | 22,855,632 | |
| $68,250 | 22,840,069 | |
| $64,643 | 22,822,304 | |
| $88,299 | 22,896,523 | |
| $87,914 | 22,857,168 | |
| $90,815 | 22,927,538 | |
| $109,580 | 22,975,375 | |
| $109,008 | 22,972,620 | |
| $111,258 | 22,963,772 | |
| $117,835 | 23,005,006 | |
| $106,113 | 22,891,486 | |
| $109,451 | 22,844,132 | |
| $93,759 | 22,596,130 | |
| $82,633 | 22,406,207 | |
| $84,330 | 22,286,291 | |
| $102,421 | 22,271,914 | |
| $95,735 | 22,152,070 | |
| $95,907 | 21,991,408 | |
| $72,733 | 21,560,731 |
Keep exploring



Source: Calculated by Maketo on one combined spot market, daily candles. Reading for .