

BITCOIN CHAIKIN MONEY FLOW
Where are the busiest candles closing?
Falling, at −0.0729. As of Oct 20, 2026.
Bitcoin Chaikin Money Flow
Daily candles
1D candles. Last closed candle: 2026-10-20 00:00:00 UTC.
Drag to zoom, shift and drag to pan. Click the chart before scrolling to zoom with the wheel, and press Escape to let the page scroll again. The candle interval changes the calculation; the range buttons change only the dates on screen.
CMF averages candle closing position using trading volume as the weight. It focuses on a fixed window instead of a lifetime cumulative total. Pick a candle interval and the chart recalculates.
Change the calculation
The last twelve readings as a table
| Candle start, UTC | Chaikin money flow |
|---|---|
| 2026-08-06 00:00:00 UTC | 0.097562 |
| 2026-08-14 00:00:00 UTC | -0.071742 |
| 2026-08-21 00:00:00 UTC | 0.293149 |
| 2026-08-28 00:00:00 UTC | 0.214446 |
| 2026-09-05 00:00:00 UTC | 0.310788 |
| 2026-09-12 00:00:00 UTC | -0.040909 |
| 2026-09-19 00:00:00 UTC | -0.023733 |
| 2026-09-27 00:00:00 UTC | 0.047409 |
| 2026-10-04 00:00:00 UTC | 0.092199 |
| 2026-10-12 00:00:00 UTC | -0.164416 |
| 2026-10-19 00:00:00 UTC | -0.138324 |
| 2026-10-20 00:00:00 UTC | -0.072853 |
Quote this chart
The image is of the chart as you have it. The link is to the page, which opens on the published reading, so the sentence above is what tells a reader which interval and formula the quotation was taken on.
Maketo. Bitcoin Chaikin Money Flow (cmf; period 20), 1D candles, Maketo combined market. Last closed candle: 2026-10-20 00:00:00 UTC. Calculation version 1.0.0. https://maketo.com/technical-indicators/chaikin-money-flow
Source: <a href="https://maketo.com/technical-indicators/chaikin-money-flow">Maketo Bitcoin Chaikin Money Flow</a>
RIGHT NOW
Falling, at −0.0729. As of Oct 20, 2026.
What the day shows
At the 2026-10-20 UTC close, the reading was -0.0728531. The previous available reading was -0.138324. This weighs where each day closes inside its range by how much Bitcoin traded that day. The selected period is 20 daily candles.
How to read that number
Above zero means volume-weighted closes leaned toward candle highs. Below zero means they leaned toward lows. Zero means those contributions balanced.
What it was read at
Chaikin money flow, period 20, on daily candles. Change the interval or the settings on the chart above and every number there is recalculated in your browser. This sentence keeps the daily reading the page is published on.
Understanding
Bitcoin Chaikin Money Flow
Where it stands today
Chaikin Money Flow: falling, at −0.0729 as of .
What is Bitcoin Chaikin Money Flow?
Chaikin Money Flow measures whether more of a window’s trading volume occurred in candles that finished near their highs or near their lows. It uses each candle’s closing position as a weight, then normalizes the result by total volume. Despite the name, it does not measure dollars entering or leaving Bitcoin.For each candle, the multiplier is (2 × close − low − high) ÷ (high − low). Multiply that ratio by the candle’s BTC volume, add the weighted amounts across the selected period, and divide by the total BTC volume across the same candles. The default period is 20. The final unit is a ratio because BTC in the numerator and denominator cancels.This normalization makes the result easier to compare across windows with different amounts of trading. A value of 0.20 means the sum of the closing-position weights, after weighting by volume, is 0.20. It does not mean buyers purchased 20% more Bitcoin than sellers. All trades have both a buyer and a seller, and the formula never reads which side initiated them.
Positive and negative describe closing position
A positive reading means the volume-weighted closing positions leaned toward the upper halves of their candles. A negative reading means they leaned toward the lower halves. A result near zero can come from offsetting contributions, many middle-of-range closes, or some combination of both.
Maketo leaves a middle region
The directional label is Rising at 0.05 or higher and Falling at −0.05 or lower. Values between those boundaries are Mixed. These cutoffs make the classification explicit; they are not a tested probability of the next price move, and crossing them does not establish that price itself crossed any level.
A large-volume candle has greater influence
A candle with twice as much volume contributes twice as much weight when its closing position is the same. A small-volume close at the high need not outweigh a much busier candle that closed below its midpoint. Inspect both ingredients when a reading changes sharply.
How Chaikin Money Flow is calculated
Sum close-location multiplier × volume over 20 candles, then divide by total volume over those candles. The page is published on Chaikin money flow, period 20. A period counts candles at the interval you choose, so the same setting covers a different stretch of time on a one-hour chart than on a daily one. How smoothing and missing candles are handled.
A calculation you can follow
This illustrative three-candle calculation starts with the closing-position multipliers already calculated, so the effect of volume is visible. The first candle has multiplier +0.8 and 100 BTC of volume. It contributes +80 weighted BTC.The second has multiplier −0.5 and 200 BTC of volume. It contributes −100 weighted BTC, outweighing the first candle despite its less extreme multiplier.The third has multiplier +0.5 and 100 BTC of volume. It contributes +50 weighted BTC.The weighted sum is 80 − 100 + 50 = 30 BTC. Total volume is 400 BTC. Chaikin Money Flow is 30 ÷ 400 = 0.075, which is above Maketo’s 0.05 boundary.The result describes an average closing-position weight of 0.075. The 30 in the numerator is a constructed weighted amount, not an observed net purchase or a dollar inflow.
The rolling window
Twenty candles means twenty of the selected interval. A shorter period lets each new candle replace a larger share of the window. A longer period retains more earlier activity. Because old candles leave, the ratio can change noticeably even when the newest candle makes only a small contribution.
Flat candles, empty volume, and missing data
A candle with no high-to-low range receives a zero multiplier. If the whole window has recorded zero volume, Maketo returns zero by convention. Missing volume is different from recorded zero volume and leaves the required calculation unavailable. With valid candles and nonnegative volume, the usual ratio lies between −1 and +1.
A positive result can accompany a price decline
Closes near the highs of successive candles can still be lower than earlier closes. This indicator compares each close with its own candle’s range, not with the preceding close. Check the price path separately.
Normalization does not make markets identical
A dimensionless ratio removes the size of the volume unit, but it does not remove differences in candle construction or the market covered. Two feeds can produce different ratios from the same named formula.
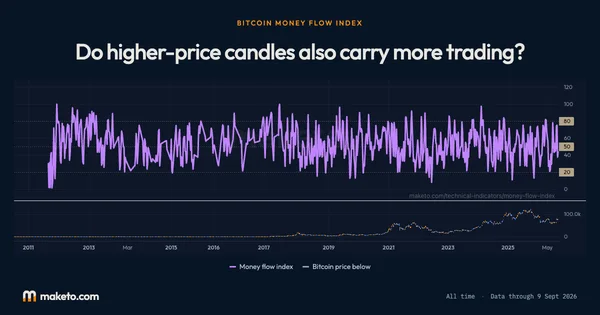
Chaikin Money Flow compared with Money Flow Index
Money Flow Index assigns a candle’s approximate dollar-weighted activity to the positive or negative side according to whether its typical price increased. Chaikin Money Flow instead uses closing position inside the candle. Their readings can disagree because they define the positive contribution differently. Open Bitcoin Money Flow Index.
Is 0.20 the same as 20 on another chart?
It can be if that chart multiplies the ratio by 100. Maketo displays the unscaled ratio. Check the stated scale before comparing numbers, and avoid treating either display as a percentage of actual buyers.
How is this different from the Chaikin Oscillator?
The oscillator subtracts two exponential averages of the cumulative Accumulation/Distribution Line. Chaikin Money Flow divides a rolling weighted-volume sum by a rolling total-volume sum. Their shared candle multiplier does not make the final calculations interchangeable.
The numbers
behind the chart
What does the current reading show?
Bitcoin price: the latest reading is $82,946, on . The highest reading since is $123,325 on ; the lowest is $0.0495 on .
Chaikin money flow: the latest reading is −0.0729, on . The highest reading since is 0.6097 on ; the lowest is −0.3584 on .
Readings since Jul 17, 2010 let you compare Oct 20, 2026 with earlier months. Highest and lowest cover every reading shown; month-end values use the last reading on or before that date. Every figure here is the published daily reading at Chaikin money flow, period 20, beside Bitcoin's own close on the same day. Change the interval or the settings on the chart above and the chart is recalculated in your browser, but this record is not. How Maketo measures the Bitcoin price.
What are the latest, highest and lowest readings?
| Measure | Latest | Highest | Lowest |
|---|---|---|---|
| Bitcoin price | $82,946 | $123,325 | $0.0495 |
| Chaikin money flow | −0.0729 | 0.6097 | −0.3584 |
How do the readings compare with earlier dates?
| Reference date | Bitcoin price | Chaikin money flow |
|---|---|---|
| 1 month ago | $81,235 | −0.0237 |
| 3 months ago | $64,717 | 0.1263 |
| 6 months ago | $75,718 | 0.0732 |
| 1 year ago | $110,784 | 0.1465 |
| 2 years ago | $68,427 | −0.0075 |
What was the reading at each month’s end?
| Reading date | Bitcoin price | Chaikin money flow |
|---|---|---|
| $84,462 | 0.0474 | |
| $77,842 | 0.2144 | |
| $64,723 | 0.0170 | |
| $58,532 | −0.0128 | |
| $76,980 | −0.0130 | |
| $77,632 | 0.0499 | |
| $68,800 | −0.0141 | |
| $67,991 | 0.1363 | |
| $88,299 | −0.0119 | |
| $87,914 | −0.1186 | |
| $90,897 | −0.0519 | |
| $108,310 | −0.1220 | |
| $114,057 | 0.1097 | |
| $113,484 | 0.0355 | |
| $117,941 | 0.1484 | |
| $106,983 | 0.1898 | |
| $107,797 | 0.1901 | |
| $95,028 | 0.2815 | |
| $82,385 | 0.1596 | |
| $84,330 | 0.0512 | |
| $104,733 | 0.1307 | |
| $93,479 | −0.0842 | |
| $97,954 | 0.3137 | |
| $67,053 | 0.0955 |
Keep exploring



Source: Calculated by Maketo on one combined spot market, daily candles. Reading for .