

BITCOIN COMMODITY CHANNEL INDEX
How far is price from its recent average?
Falling, at −38.54. As of Oct 20, 2026.
Bitcoin Commodity Channel Index
Daily candles
1D candles. Last closed candle: 2026-10-20 00:00:00 UTC.
Drag to zoom, shift and drag to pan. Click the chart before scrolling to zoom with the wheel, and press Escape to let the page scroll again. The candle interval changes the calculation; the range buttons change only the dates on screen.
CCI asks how far a candle’s typical price sits from its recent average, allowing for the usual size of those deviations. Despite its name, it can describe Bitcoin as well as commodities. Pick a candle interval and the chart recalculates.
Change the calculation
The last twelve readings as a table
| Candle start, UTC | CCI |
|---|---|
| 2026-08-06 00:00:00 UTC | 8.053 |
| 2026-08-14 00:00:00 UTC | -110.84 |
| 2026-08-21 00:00:00 UTC | 373.57 |
| 2026-08-28 00:00:00 UTC | 85.515 |
| 2026-09-05 00:00:00 UTC | 66.252 |
| 2026-09-12 00:00:00 UTC | -112.92 |
| 2026-09-19 00:00:00 UTC | 159.51 |
| 2026-09-27 00:00:00 UTC | 87.874 |
| 2026-10-04 00:00:00 UTC | 82.751 |
| 2026-10-12 00:00:00 UTC | -119.56 |
| 2026-10-19 00:00:00 UTC | -55.25 |
| 2026-10-20 00:00:00 UTC | -38.541 |
Quote this chart
The image is of the chart as you have it. The link is to the page, which opens on the published reading, so the sentence above is what tells a reader which interval and formula the quotation was taken on.
Maketo. Bitcoin Commodity Channel Index (cci; period 20), 1D candles, Maketo combined market. Last closed candle: 2026-10-20 00:00:00 UTC. Calculation version 1.0.0. https://maketo.com/technical-indicators/cci
Source: <a href="https://maketo.com/technical-indicators/cci">Maketo Bitcoin Commodity Channel Index</a>
RIGHT NOW
Falling, at −38.54. As of Oct 20, 2026.
What the day shows
At the 2026-10-20 UTC close, the reading was -38.5411. The previous available reading was -55.25. This measures how far the typical daily price sits from its recent average. The selected period is 20 daily candles.
How to read that number
Positive readings put typical price above its recent average; negative readings put it below. A larger magnitude means a larger departure from the recent pattern.
What it was read at
CCI, period 20, on daily candles. Change the interval or the settings on the chart above and every number there is recalculated in your browser. This sentence keeps the daily reading the page is published on.
Understanding
Bitcoin Commodity Channel Index
Where it stands today
Commodity Channel Index: falling, at −38.54 as of .
What is Bitcoin Commodity Channel Index?
Bitcoin’s Commodity Channel Index, or CCI, measures how far the current candle’s typical price sits from its recent average. Typical price here means the average of the high, low and close. The distance is divided by a measure of the window’s usual variation, making a given dollar gap look larger when recent candles have clustered tightly together.Despite its name, CCI does not need commodity data. Maketo calculates it from Bitcoin candles with a default period of 20. It has a center at zero but no fixed upper or lower limit. A reading of 200 is possible; it is neither a percentage price change nor twice the probability attached to a reading of 100.
Start with the sign
Positive CCI means the current typical price is above the window’s average typical price. Negative CCI means it is below. At zero they are equal, or the entire typical-price window is flat under Maketo’s flat-window convention. The page’s direction label follows that sign.
Understand what makes the number large
CCI = (typical price − its simple average) ÷ (0.015 × mean absolute deviation). Mean absolute deviation is the average distance of each window value from the current window mean, ignoring whether that distance is above or below. A small denominator makes a modest dollar gap produce a large reading.
Read familiar levels as distances
CCI of +100 means the current typical price is 1.5 times that mean distance above the average. At −100 it is the same distance below. The 0.015 factor sets this scale; it does not establish fixed odds that price will reverse or that a set percentage of Bitcoin observations must remain inside ±100.
How Commodity Channel Index is calculated
Typical price = (high + low + close) / 3. CCI divides its distance from the 20-candle average by 0.015 times the average absolute deviation. The page is published on CCI, period 20. A period counts candles at the interval you choose, so the same setting covers a different stretch of time on a one-hour chart than on a daily one. How smoothing and missing candles are handled.
A calculation you can follow
A three-candle example keeps every arithmetic step visible. The live default uses 20 candles instead. Suppose three candles have typical prices of $90,000, $100,000 and $110,000. Each typical price is calculated separately as (high + low + close) ÷ 3.Their simple average is ($90,000 + $100,000 + $110,000) ÷ 3 = $100,000.The absolute distances from that average are $10,000, $0 and $10,000. Their mean is $6,666.67, using the unrounded fraction in the calculation.The latest typical price is $10,000 above the mean. Divide by 0.015 × $6,666.67, approximately $100: CCI is 100.The same dollar gap would produce a smaller CCI if earlier typical prices were more spread out. CCI describes distance relative to its own recent window, not distance from a permanent fair price.
The 20-candle window
A shorter window changes the average and its mean distance more quickly. A longer one retains older price conditions. Both numerator and denominator change when the period changes, so doubling the period does not simply halve the reading.
Candle interval
Twenty daily candles summarize 20 days; twenty 4-hour candles summarize 80 hours. Higher-timeframe candles also have their own highs, lows and closes. A daily CCI is therefore not an average of intraday CCI values.
The selected price
This page uses high, low and close equally when forming typical price. It does not use the candle’s opening price or weight the inputs by volume. A long upper wick can lift typical price even when the close barely changes.
A changing denominator can hide the move
After a very large candle, the window’s average distance may expand. Price can move further from its average while CCI rises less than expected, because the reference spread expanded too. Read both the price gap and the recent candle shapes before interpreting the index alone.
Do not substitute standard deviation
Mean absolute deviation averages absolute distances. Standard deviation squares the distances before averaging and taking a square root, giving unusually large deviations more influence. Replacing one with the other changes CCI’s formula and its familiar numerical scale.
An old extreme can move the reading as it leaves
The window rolls forward one candle at a time. Dropping an old unusual typical price changes the mean and the denominator, even if the new candle looks ordinary. That mechanical change is not evidence of a fresh burst of trading.
Commodity Channel Index compared with Bollinger Bands
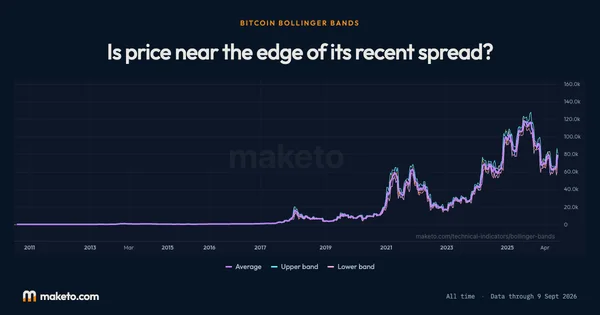
Bollinger Bands compare closes with an average using standard deviation. CCI uses high-low-close typical prices and mean absolute deviation. Comparing them reveals whether a reading depends on candle wicks, the distance measure, or both; their numerical levels are not interchangeable. Open Bitcoin Bollinger Bands.
Is CCI bounded between −100 and +100?
No. Those are reference levels on an unbounded scale. Values outside them describe larger departures from the window average, not an invalid calculation.
Can CCI rise while the latest close is unchanged?
Yes. A different high or low can change typical price. The rolling average and mean absolute deviation can also change as older candles leave the window.
The numbers
behind the chart
What does the current reading show?
Bitcoin price: the latest reading is $82,946, on . The highest reading since is $123,325 on ; the lowest is $0.0495 on .
CCI: the latest reading is −38.54, on . The highest reading since is 628.37 on ; the lowest is −505.81 on .
Readings since Jul 17, 2010 let you compare Oct 20, 2026 with earlier months. Highest and lowest cover every reading shown; month-end values use the last reading on or before that date. Every figure here is the published daily reading at CCI, period 20, beside Bitcoin's own close on the same day. Change the interval or the settings on the chart above and the chart is recalculated in your browser, but this record is not. How Maketo measures the Bitcoin price.
What are the latest, highest and lowest readings?
| Measure | Latest | Highest | Lowest |
|---|---|---|---|
| Bitcoin price | $82,946 | $123,325 | $0.0495 |
| CCI | −38.54 | 628.37 | −505.81 |
How do the readings compare with earlier dates?
| Reference date | Bitcoin price | CCI |
|---|---|---|
| 1 month ago | $81,235 | 159.51 |
| 3 months ago | $64,717 | 114.33 |
| 6 months ago | $75,718 | 119.88 |
| 1 year ago | $110,784 | −70.97 |
| 2 years ago | $68,427 | 156.09 |
What was the reading at each month’s end?
| Reading date | Bitcoin price | CCI |
|---|---|---|
| $84,462 | 87.87 | |
| $77,842 | 85.52 | |
| $64,723 | 1.42 | |
| $58,532 | −127.59 | |
| $76,980 | −82.22 | |
| $77,632 | 98.93 | |
| $68,800 | −42.91 | |
| $67,991 | −31.01 | |
| $88,299 | −108.61 | |
| $87,914 | −40.29 | |
| $90,897 | −25.34 | |
| $108,310 | −67.27 | |
| $114,057 | −5.90 | |
| $113,484 | −113.19 | |
| $117,941 | 29.19 | |
| $106,983 | 67.81 | |
| $107,797 | 55.68 | |
| $95,028 | 107.02 | |
| $82,385 | −79.25 | |
| $84,330 | −214.24 | |
| $104,733 | 72.93 | |
| $93,479 | −90.26 | |
| $97,954 | 95.01 | |
| $67,053 | 39.99 |
Keep exploring


Source: Calculated by Maketo on one combined spot market, daily candles. Reading for .