

BITCOIN BOLLINGER BANDS
Is price near the edge of its recent spread?
Falling, at $83,215. As of Oct 20, 2026.
Bitcoin Bollinger Bands
Daily candles
1D candles. Last closed candle: 2026-10-20 00:00:00 UTC.
Drag to zoom, shift and drag to pan. Click the chart before scrolling to zoom with the wheel, and press Escape to let the page scroll again. The candle interval changes the calculation; the range buttons change only the dates on screen.
Bollinger Bands place an upper and lower line around an average close. Their distance changes with the recent spread of closes. Pick a candle interval and the chart recalculates.
Change the calculation
The last twelve readings as a table
| Candle start, UTC | Average |
|---|---|
| 2026-08-06 00:00:00 UTC | $64,387.86 |
| 2026-08-14 00:00:00 UTC | $63,947.39 |
| 2026-08-21 00:00:00 UTC | $65,375.39 |
| 2026-08-28 00:00:00 UTC | $70,363.57 |
| 2026-09-05 00:00:00 UTC | $76,461.47 |
| 2026-09-12 00:00:00 UTC | $78,590.39 |
| 2026-09-19 00:00:00 UTC | $78,321.94 |
| 2026-09-27 00:00:00 UTC | $80,433.93 |
| 2026-10-04 00:00:00 UTC | $82,859.97 |
| 2026-10-12 00:00:00 UTC | $84,011.19 |
| 2026-10-19 00:00:00 UTC | $83,245.63 |
| 2026-10-20 00:00:00 UTC | $83,214.7 |
Quote this chart
The image is of the chart as you have it. The link is to the page, which opens on the published reading, so the sentence above is what tells a reader which interval and formula the quotation was taken on.
Maketo. Bitcoin Bollinger Bands (bands; period 20, deviations 2), 1D candles, Maketo combined market. Last closed candle: 2026-10-20 00:00:00 UTC. Calculation version 1.0.0. https://maketo.com/technical-indicators/bollinger-bands
Source: <a href="https://maketo.com/technical-indicators/bollinger-bands">Maketo Bitcoin Bollinger Bands</a>
RIGHT NOW
Falling, at $83,215. As of Oct 20, 2026.
What the day shows
At the 2026-10-20 UTC close, the reading was 83,214.7. The previous available reading was 83,245.6. The lines widen when daily closes spread farther from their average. The selected period is 20 daily candles.
How to read that number
Narrowing bands show a smaller recent spread; widening bands show a larger spread. A price outside a band is an observed extreme relative to that window.
What it was read at
Bollinger Bands, deviations 2, period 20, on daily candles. Change the interval or the settings on the chart above and every number there is recalculated in your browser. This sentence keeps the daily reading the page is published on.
Understanding
Bitcoin Bollinger Bands
Where it stands today
Bollinger Bands: falling, at $83,215 as of .
What is Bitcoin Bollinger Bands?
Bollinger Bands put a moving reference around Bitcoin price. The middle line is the average closing price over the selected window. The outer lines move farther apart when those closes are more spread out and closer together when they cluster. They answer two separate questions: where price sits against its recent average, and how widely recent closing prices differ.Maketo starts with 20 candles and a width of two standard deviations. Standard deviation is a measure of distance from the average, expressed in dollars here. The calculation squares each close’s distance from the average, averages those squared distances across all 20 closes, then takes the square root. Both outer bands use that same window and the same closing prices.The three views describe the same calculation in different units. Bands show dollar levels. Percent B shows price’s position between the two outer bands as a ratio. Band width expresses the distance between those bands as a percentage of the middle line. Switching views changes the question you are inspecting, rather than adding a separate source of evidence.
Read position and direction separately
A close above the middle line is above the recent average. If that average is also rising, the two observations agree on upward direction. Price can be above a falling average after a bounce, or below a rising average after a decline. Maketo’s directional reading checks price against the middle line and the middle line against its value five candles earlier; disagreement produces Mixed.
Understand the position ratio
Percent B equals (close − lower band) / (upper band − lower band). Zero means the lower band, 0.5 the middle, and 1 the upper band. Values below zero or above 1 are valid: price has moved outside the band. A reading of 0.75 means three quarters of the distance from lower to upper, not a 75% chance of a further rise.
Read narrowing bands without guessing the next move
Band width equals 100 × (upper − lower) / middle. A shrinking value says the closes have become less spread out relative to their average. It does not identify the direction or timing of the next large move. Widening bands can accompany rising prices, falling prices, or a sharp change between the two.
How Bollinger Bands is calculated
The default center is a 20-candle simple average. Bands sit two population standard deviations above and below it. Percent B locates price between the bands; width measures their percentage separation. The page is published on Bollinger Bands, deviations 2, period 20. A period counts candles at the interval you choose, so the same setting covers a different stretch of time on a one-hour chart than on a daily one. How smoothing and missing candles are handled.
A calculation you can follow
Use 20 illustrative closes to make every part of the calculation visible: ten at $98,000 and ten at $102,000, with the final close at $102,000. These are arithmetic examples, not dated Bitcoin observations. The average is (10 × $98,000 + 10 × $102,000) / 20 = $100,000.Every close is $2,000 from that average. Averaging the squared distances and taking the square root gives a standard deviation of $2,000.With a multiplier of 2, the upper band is $104,000 and the lower band is $96,000.Percent B is ($102,000 − $96,000) / $8,000 = 0.75. Band width is 100 × $8,000 / $100,000 = 8%.The close sits in the upper half of an 8%-wide band. Those facts describe position and spread. The example alone does not establish a price reversal or the slope of the preceding average.
Period
Twenty 1-hour candles cover 20 hours; twenty daily candles cover 20 days. A longer period incorporates more history and changes both the average and its measured spread. It does not simply enlarge the same band.
Width multiplier
Raising the multiplier widens both sides without changing the middle line. Moving from 2 to 3 increases the distance from the middle to each band by 50%, using the same prices. A multiplier of zero collapses both bands onto the average.
Calculation convention
Maketo divides the squared distances by the full window length, not by one less. A chart using the other divisor will show slightly wider bands. Compare period, candle interval, closing-price source and divisor before comparing exact values.
A band touch does not promise a turn
Price can remain near an outer band across a sustained move. Being relatively high inside a recent price window is different from proving that Bitcoin is expensive or about to fall. Likewise, a close near the lower band can occur during an extended decline.
Two deviations are not a confidence guarantee
These bands are calculated from a short, changing sample of prices. Their width does not promise that a fixed percentage of future prices will remain inside them. A very wide historical observation also stops affecting the calculation once it leaves the selected window.
Bollinger Bands compared with Keltner Channels
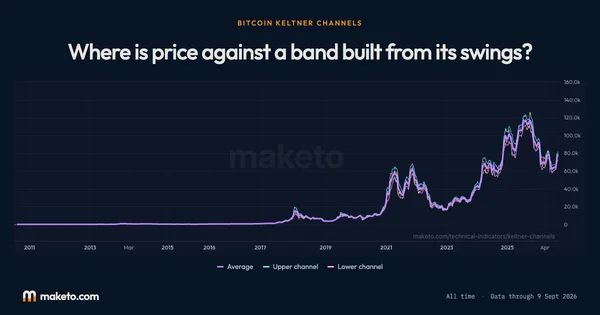
Keltner Channels also draw lines around an average, but their width uses true range, which considers candle highs, lows and the previous close. Bollinger Bands use the spread of closes. Large intraday wicks with tightly grouped closes can therefore widen Keltner Channels more than Bollinger Bands. Open Bitcoin Keltner Channels.
Can Percent B be greater than 1?
Yes. It means the close is above the calculated upper band. It is a position ratio rather than a capped score. Below zero means the close is below the lower band.
What happens when every closing price is identical?
The spread is zero, so the bands meet at the average. Maketo reports Percent B as 0.5 for that collapsed band and band width as zero. That convention avoids dividing by zero.
Why can the live chart differ from the daily reading?
The live chart may include a forming candle, while the daily reading uses a completed daily candle. Compare the candle interval, completion state and observation time before treating different values as a calculation disagreement.
The numbers
behind the chart
What does the current reading show?
Bitcoin price: the latest reading is $82,946, on . The highest reading since is $123,325 on ; the lowest is $0.0495 on .
Average: the latest reading is $83,215, on . The highest reading since is $117,680 on ; the lowest is $0.0617 on .
Upper band: the latest reading is $86,321, on . The highest reading since is $127,431 on ; the lowest is $0.0632 on .
Lower band: the latest reading is $80,109, on . The highest reading since is $113,982 on ; the lowest is −$0.9970 on .
Readings since Jul 17, 2010 let you compare Oct 20, 2026 with earlier months. Highest and lowest cover every reading shown; month-end values use the last reading on or before that date. Every figure here is the published daily reading at Bollinger Bands, deviations 2, period 20, beside Bitcoin's own close on the same day. Change the interval or the settings on the chart above and the chart is recalculated in your browser, but this record is not. How Maketo measures the Bitcoin price.
What are the latest, highest and lowest readings?
| Measure | Latest | Highest | Lowest |
|---|---|---|---|
| Bitcoin price | $82,946 | $123,325 | $0.0495 |
| Average | $83,215 | $117,680 | $0.0617 |
| Upper band | $86,321 | $127,431 | $0.0632 |
| Lower band | $80,109 | $113,982 | −$0.9970 |
How do the readings compare with earlier dates?
| Reference date | Bitcoin price | Average | Upper band | Lower band |
|---|---|---|---|---|
| 1 month ago | $81,235 | $78,322 | $81,737 | $74,907 |
| 3 months ago | $64,717 | $62,260 | $66,036 | $58,484 |
| 6 months ago | $75,718 | $71,255 | $77,744 | $64,765 |
| 1 year ago | $110,784 | $116,802 | $126,988 | $106,616 |
| 2 years ago | $68,427 | $63,427 | $68,551 | $58,302 |
What was the reading at each month’s end?
| Reading date | Bitcoin price | Average | Upper band | Lower band |
|---|---|---|---|---|
| $84,462 | $80,434 | $87,785 | $73,082 | |
| $77,842 | $70,364 | $84,417 | $56,310 | |
| $64,723 | $64,473 | $66,324 | $62,623 | |
| $58,532 | $62,646 | $67,200 | $58,093 | |
| $76,980 | $79,024 | $82,979 | $75,069 | |
| $77,632 | $74,467 | $79,700 | $69,235 | |
| $68,800 | $70,307 | $74,454 | $66,159 | |
| $67,991 | $67,996 | $71,420 | $64,572 | |
| $88,299 | $91,568 | $97,242 | $85,895 | |
| $87,914 | $88,550 | $92,481 | $84,619 | |
| $90,897 | $93,377 | $106,142 | $80,612 | |
| $108,310 | $110,722 | $116,005 | $105,439 | |
| $114,057 | $114,107 | $118,936 | $109,278 | |
| $113,484 | $116,677 | $121,804 | $111,551 | |
| $117,941 | $116,867 | $123,400 | $110,334 | |
| $106,983 | $105,831 | $110,311 | $101,352 | |
| $107,797 | $106,170 | $111,423 | $100,918 | |
| $95,028 | $87,667 | $97,658 | $77,676 | |
| $82,385 | $84,443 | $88,177 | $80,709 | |
| $84,330 | $94,206 | $103,495 | $84,918 | |
| $104,733 | $101,528 | $108,742 | $94,313 | |
| $93,479 | $98,258 | $106,256 | $90,261 | |
| $97,954 | $87,534 | $104,695 | $70,372 | |
| $67,053 | $65,556 | $71,094 | $60,017 |
Keep exploring


Source: Calculated by Maketo on one combined spot market, daily candles. Reading for .