

BITCOIN MONEY FLOW INDEX
Do higher-price candles also carry more trading?
Mixed, at 46.70. As of Oct 20, 2026.
Bitcoin Money Flow Index
Daily candles
1D candles. Last closed candle: 2026-10-20 00:00:00 UTC.
Drag to zoom, shift and drag to pan. Click the chart before scrolling to zoom with the wheel, and press Escape to let the page scroll again. The candle interval changes the calculation; the range buttons change only the dates on screen.
MFI uses a candle’s typical price and volume, then separates candles according to whether typical price rose or fell. It puts the balance on a 0–100 scale. Pick a candle interval and the chart recalculates.
Change the calculation
The last twelve readings as a table
| Candle start, UTC | Money flow index |
|---|---|
| 2026-08-05 00:00:00 UTC | 40.705 |
| 2026-08-13 00:00:00 UTC | 36.926 |
| 2026-08-20 00:00:00 UTC | 64.211 |
| 2026-08-28 00:00:00 UTC | 78.926 |
| 2026-09-04 00:00:00 UTC | 56.415 |
| 2026-09-12 00:00:00 UTC | 46.761 |
| 2026-09-19 00:00:00 UTC | 53.624 |
| 2026-09-27 00:00:00 UTC | 63.268 |
| 2026-10-04 00:00:00 UTC | 66.322 |
| 2026-10-12 00:00:00 UTC | 47.326 |
| 2026-10-19 00:00:00 UTC | 39.631 |
| 2026-10-20 00:00:00 UTC | 46.696 |
Quote this chart
The image is of the chart as you have it. The link is to the page, which opens on the published reading, so the sentence above is what tells a reader which interval and formula the quotation was taken on.
Maketo. Bitcoin Money Flow Index (mfi; period 14), 1D candles, Maketo combined market. Last closed candle: 2026-10-20 00:00:00 UTC. Calculation version 1.0.0. https://maketo.com/technical-indicators/money-flow-index
Source: <a href="https://maketo.com/technical-indicators/money-flow-index">Maketo Bitcoin Money Flow Index</a>
RIGHT NOW
Mixed, at 46.70. As of Oct 20, 2026.
What the day shows
At the 2026-10-20 UTC close, the reading was 46.6964. The previous available reading was 39.6314. This compares rising-price and falling-price days while accounting for how much Bitcoin traded. The selected period is 14 daily candles.
How to read that number
Higher readings mean rising-typical-price candles carried more weighted activity. Compare with RSI to see whether adding volume changes the picture.
What it was read at
Money flow index, period 14, on daily candles. Change the interval or the settings on the chart above and every number there is recalculated in your browser. This sentence keeps the daily reading the page is published on.
Understanding
Bitcoin Money Flow Index
Where it stands today
Money Flow Index: mixed, at 46.70 as of .
What is Bitcoin Money Flow Index?
Money Flow Index, or MFI, compares trading activity associated with increases and decreases in a candle’s typical price. It combines price and volume into a score from 0 to 100. It is often compared with RSI because both use that scale, but MFI includes volume and uses the average of each candle’s high, low, and close rather than closing-price changes alone.Typical price equals (high + low + close) ÷ 3. Multiplying it by volume in BTC gives an approximate dollar-weighted amount for that candle. If typical price rose from the preceding candle, the whole amount enters the positive group. If it fell, the amount enters the negative group. An unchanged typical price enters neither group. The default window contains 14 such comparisons.Maketo divides the positive total by the positive plus negative totals, then multiplies by 100. This is equivalent to the familiar money-flow-ratio formula when both sides are nonzero. The final number is a score, not a dollar amount, a percentage return, or a count of buyers. The approximate dollar weights come from candle prices, not the individual prices of every trade.
Read the balance represented by the score
Above 50, more of the window’s assigned dollar-weighted activity belongs to candles with rising typical prices. Below 50, more belongs to falling typical prices. A score of 75 means three times as much assigned positive weight as negative weight. It does not mean 75% of market participants bought Bitcoin.
Separate level from recent change
A fall from 80 to 65 leaves the positive group larger, even though its relative share has declined. A rise from 20 to 35 leaves the negative group larger. Maketo labels readings of 55 or more Rising, 45 or less Falling, and the middle region Mixed. The label describes the current balance rather than the slope of the last two readings.
Check what gave a candle its weight
A small increase in typical price can assign a large amount to the positive group if volume was high. The size of that price increase does not scale the weight. A candle whose typical price rises slightly can therefore contribute more than a quiet candle with a much larger increase.
How Money Flow Index is calculated
Typical price is (high + low + close) / 3. Multiply by volume, sum positive and negative typical-price moves over 14 candles, then apply the RSI-style ratio transform. The page is published on Money flow index, period 14. A period counts candles at the interval you choose, so the same setting covers a different stretch of time on a one-hour chart than on a daily one. How smoothing and missing candles are handled.
A calculation you can follow
This illustrative three-comparison example shows the weighting directly. It uses a shorter window than the 14-candle default. Start with a preceding typical price of $99,000. The next candle has typical price $100,000 and volume 10 BTC, so $1,000,000 enters the positive group.The following typical price is $102,000 with 5 BTC traded. Another $510,000 enters the positive group, taking its total to $1,510,000.The next typical price falls to $101,000 with 10 BTC traded. Its $1,010,000 enters the negative group.MFI is 100 × 1,510,000 ÷ (1,510,000 + 1,010,000), or approximately 59.92. It is above the midpoint even though the last typical-price change was downward.The result summarizes the window’s assigned activity. It cannot be read as a direct measure of net cash entering Bitcoin, and it need not follow the latest price change.
Period and the preceding candle
The default needs 14 comparisons, so it requires 15 consecutive candles with the necessary prices and volume. A shorter period replaces earlier contributions faster. Changing the interval changes both the elapsed time covered and how trades are grouped into typical prices.
One-sided and empty windows
If the positive total is nonzero and the negative total is zero, the score is 100. The reverse produces 0. If both totals are zero, Maketo uses 50 by convention. Missing required volume is not treated as an empty, balanced window.
High does not mean an imminent decline
A high score says the recent assigned weights were mostly positive. Such a balance can persist during a continuing price rise. Turning the score into a forecast requires evidence beyond this calculation.
The word money can suggest too much precision
Typical price multiplied by BTC volume is a candle approximation. It is not the exact sum of trade values, a fund-flow report, or a measure of the market’s cash balance. The final ratio is useful without making any of those claims.
Money Flow Index compared with RSI
RSI compares smoothed gains and losses in closing price. MFI instead groups approximate dollar-weighted activity by changes in typical price. Equal scales do not make equal readings equivalent: a high-volume candle affects MFI directly but has no separate volume weight in RSI. Open Bitcoin RSI.
Does a flat typical price count as negative flow?
No. Maketo assigns it to neither side, even when the candle has recorded volume. That activity is real, but it has no positive or negative contribution under this particular rule.
Why can MFI and Bitcoin’s closing price disagree?
MFI uses the high, low, and close together, weights candles by volume, and sums a rolling window. Closing price uses one price observation. Check those differences before treating a disagreement as evidence of a coming reversal.
The numbers
behind the chart
What does the current reading show?
Bitcoin price: the latest reading is $82,946, on . The highest reading since is $122,274 on ; the lowest is $0.0495 on .
Money flow index: the latest reading is 46.70, on . The highest reading since is 97.16 on ; the lowest is 4.08 on .
Readings since Jul 17, 2010 let you compare Oct 20, 2026 with earlier months. Highest and lowest cover every reading shown; month-end values use the last reading on or before that date. Every figure here is the published daily reading at Money flow index, period 14, beside Bitcoin's own close on the same day. Change the interval or the settings on the chart above and the chart is recalculated in your browser, but this record is not. How Maketo measures the Bitcoin price.
What are the latest, highest and lowest readings?
| Measure | Latest | Highest | Lowest |
|---|---|---|---|
| Bitcoin price | $82,946 | $122,274 | $0.0495 |
| Money flow index | 46.70 | 97.16 | 4.08 |
How do the readings compare with earlier dates?
| Reference date | Bitcoin price | Money flow index |
|---|---|---|
| 1 month ago | $81,235 | 53.62 |
| 3 months ago | $64,989 | 78.85 |
| 6 months ago | $74,815 | 76.87 |
| 1 year ago | $107,197 | 32.46 |
| 2 years ago | $67,617 | 69.32 |
What was the reading at each month’s end?
| Reading date | Bitcoin price | Money flow index |
|---|---|---|
| $84,462 | 63.27 | |
| $77,842 | 78.93 | |
| $63,901 | 40.11 | |
| $60,164 | 22.95 | |
| $73,771 | 26.58 | |
| $76,327 | 51.69 | |
| $68,250 | 47.92 | |
| $67,627 | 27.72 | |
| $84,192 | 34.46 | |
| $87,568 | 63.39 | |
| $88,279 | 13.56 | |
| $111,658 | 54.03 | |
| $109,008 | 31.32 | |
| $111,780 | 26.51 | |
| $119,452 | 44.03 | |
| $107,077 | 48.81 | |
| $107,797 | 53.93 | |
| $94,264 | 76.21 | |
| $82,385 | 43.23 | |
| $84,330 | 10.61 | |
| $103,740 | 60.90 | |
| $92,710 | 22.74 | |
| $96,425 | 65.48 | |
| $70,262 | 55.42 |
Keep exploring
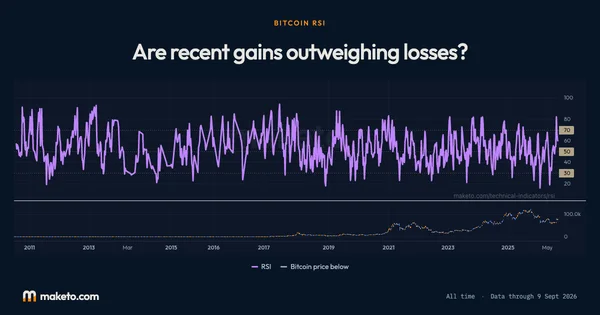



Source: Calculated by Maketo on one combined spot market, daily candles. Reading for .