

BITCOIN FIBONACCI RETRACEMENT
Where are the reference levels inside a past price move?
Reference levels, at $74,580. As of Oct 20, 2026.
Bitcoin Fibonacci Retracement
Daily candles
1D candles. Last closed candle: 2026-10-20 00:00:00 UTC.
Drag to zoom, shift and drag to pan. Click the chart before scrolling to zoom with the wheel, and press Escape to let the page scroll again. The candle interval changes the calculation; the range buttons change only the dates on screen.
Fibonacci retracement marks selected fractions of a move between two prices. It is a reference drawing, not evidence that orders or future reversals exist at those levels. Pick a candle interval and the chart recalculates.
Change the calculation
The last twelve readings as a table
| Candle start, UTC | 0% level |
|---|---|
| 2026-08-09 00:00:00 UTC | $57,740 |
| 2026-08-16 00:00:00 UTC | $57,740 |
| 2026-08-23 00:00:00 UTC | $57,740 |
| 2026-08-30 00:00:00 UTC | $81,478.87 |
| 2026-09-07 00:00:00 UTC | $82,285 |
| 2026-09-14 00:00:00 UTC | $82,285 |
| 2026-09-21 00:00:00 UTC | $82,285 |
| 2026-09-28 00:00:00 UTC | $87,395.67 |
| 2026-10-05 00:00:00 UTC | $87,395.67 |
| 2026-10-12 00:00:00 UTC | $87,395.67 |
| 2026-10-19 00:00:00 UTC | $87,395.67 |
| 2026-10-20 00:00:00 UTC | $87,395.67 |
Quote this chart
The image is of the chart as you have it. The link is to the page, which opens on the published reading, so the sentence above is what tells a reader which interval and formula the quotation was taken on.
Maketo. Bitcoin Fibonacci Retracement (automatic; period 100), 1D candles, Maketo combined market. Last closed candle: 2026-10-20 00:00:00 UTC. Calculation version 1.0.0. https://maketo.com/technical-indicators/fibonacci-retracement
Source: <a href="https://maketo.com/technical-indicators/fibonacci-retracement">Maketo Bitcoin Fibonacci Retracement</a>
RIGHT NOW
Reference levels, at $74,580. As of Oct 20, 2026.
What the day shows
At the 2026-10-20 UTC close, the reading was 74,580.3. The previous available reading was 74,580.3. These reference prices divide the previous completed price range into commonly watched proportions. The selected period is 100 daily candles.
How to read that number
Anchors define the answer. The manual view records both anchor dates and prices in the shared view so another reader can reproduce the drawing.
What it was read at
Previous 100 candles, period 100, on daily candles. Change the interval or the settings on the chart above and every number there is recalculated in your browser. This sentence keeps the daily reading the page is published on.
Understanding
Bitcoin Fibonacci Retracement
Where it stands today
Fibonacci Retracement: reference levels, at $74,580 as of .
What is Bitcoin Fibonacci Retracement?
Fibonacci Retracement divides a move between two chosen prices into reference levels. It asks how far price has moved back through that selected span. The result depends first on the anchors: changing the start, the end, or their direction changes what the percentages describe.Maketo plots 0%, 23.6%, 38.2%, 50%, 61.8%, 78.6%, and 100%. For start price A, end price B, and fraction r, the level is B + r × (A − B). Zero is the end price, 100% is the start price, and 50% is halfway between them. After an upward span, the intermediate levels lie below its end; after a downward span, they lie above it.Several of these conventional ratios relate to the Fibonacci sequence and its limiting ratios. The 50% midpoint is included by convention, rather than derived from the golden-ratio relationships behind the other levels. The arithmetic identifies fractions of a chosen range. It does not establish that those fractions attract orders, predict a reversal, or provide a probability for the next price move.
Check the anchors before reading the percentages
A 38.2% level has no standalone Bitcoin price. It belongs to a particular start and end. Read the selected prices and direction with it. A level called 61.8% on a chart that measures forward from the start may coincide with a differently labelled level on a chart measuring back from the end.
Automatic anchors use previous extremes
Maketo’s default searches the preceding 100 candles, excluding the current candle, for the highest high and lowest low. Their order in the window determines the direction of the span. It does not use a later price reversal to confirm a turning point, and it does not claim to identify the most meaningful move on the chart.
Manual anchors describe the span you specify
The manual view uses the two supplied anchor prices and times. Levels begin once both anchors’ times have been reached. The calculation preserves which anchor is supplied as start and which as end; reversing them reverses the percentage interpretation. State the anchors when sharing a manually defined chart.
How Fibonacci Retracement is calculated
An upward move from A to B places a retracement at B − ratio × (B − A). Common ratios include 23.6%, 38.2%, 50%, 61.8% and 78.6%. The automatic view uses the prior 100 completed candles. The page is published on Previous 100 candles, period 100. A period counts candles at the interval you choose, so the same setting covers a different stretch of time on a one-hour chart than on a daily one. How smoothing and missing candles are handled.
A calculation you can follow
This illustrative example compares the same $20,000 span in two directions. It does not describe a dated Bitcoin move. For a rise from A = $80,000 to B = $100,000, the 0% level is $100,000 and the 100% level is $80,000.The 38.2% level is $100,000 + 0.382 × ($80,000 − $100,000) = $92,360. Price there has moved $7,640 back through the selected $20,000 rise.The 50% midpoint is $90,000 and the 61.8% level is $87,640. These are fractions of the chosen span, not percentage returns from Bitcoin’s current price.For a decline from A = $100,000 to B = $80,000, the 38.2% level is instead $87,640. Reversing the span changes which endpoint the percentage measures back from.A percentage without its anchors is incomplete. Cite the two prices, their order, and the selected method so another reader can reproduce the reference level.
Automatic lookback
The default needs 100 preceding candles before it can display the current set. Shortening the period changes which extremes are eligible. Older extremes disappear when they leave the rolling window, so levels can change without a new record high or low in the latest candle.
Tied extremes and candle detail
When the same high or low occurs more than once, Maketo selects its most recent occurrence in the window. If both extremes belong to the same candle, the formula uses its defined low-to-high ordering; the OHLC candle does not reveal which extreme actually occurred first inside it.
Interval and line scale
One hundred hourly candles and one hundred daily candles cover different spans and may select different extremes. The levels themselves remain dollar prices. A logarithmic visual scale, if used elsewhere, does not turn this linear price interpolation into a percentage-compounded calculation.
A chosen span can explain almost any nearby price after the fact
Selecting anchors only after seeing where price paused creates a reference fitted to that outcome. Keep the anchor choice explicit rather than treating a coincident level as independent evidence that the formula predicted the pause.
A single candle cannot reveal a full price path
The high and low show the extremes reached, but not their exact internal timing. Automatic selection uses the order of candles and an explicit tie convention. It should not be described as a reconstruction of every move between trades.
Fibonacci Retracement compared with Donchian Channels
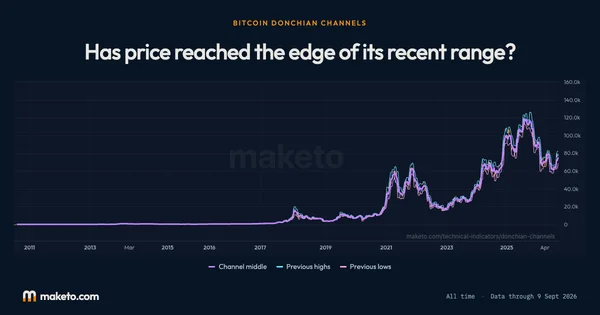
Donchian Channels also use earlier highs and lows, but show their range directly. Fibonacci Retracement subdivides an ordered span between extremes. The extra lines add reference fractions; they do not add new underlying price observations. Open Bitcoin Donchian Channels.
Is 50% a Fibonacci number or ratio?
The midpoint is included by convention. It describes halfway through a selected move, rather than following the limiting golden-ratio relationships used for the other reference levels. Its presence on a Fibonacci chart does not give halfway any special predictive property.
Why does the automatic chart move its levels?
A new eligible extreme, an older extreme leaving the window, or a change in which occurrence is selected can replace an anchor. The reference then describes a different span. Manual anchors keep that choice explicit instead of following the rolling window.
The numbers
behind the chart
What does the current reading show?
Bitcoin price: the latest reading is $82,946, on . The highest reading since is $123,334 on ; the lowest is $0.0495 on .
0% level: the latest reading is $87,396, on . The highest reading since is $126,236 on ; the lowest is $0.1900 on .
23.6% level: the latest reading is $81,347, on . The highest reading since is $121,250 on ; the lowest is $0.1475 on .
38.2% level: the latest reading is $77,605, on . The highest reading since is $118,166 on ; the lowest is $0.1212 on .
50% level: the latest reading is $74,580, on . The highest reading since is $115,673 on ; the lowest is $0.1000 on .
61.8% level: the latest reading is $71,556, on . The highest reading since is $117,933 on ; the lowest is $0.0788 on .
78.6% level: the latest reading is $67,250, on . The highest reading since is $121,584 on ; the lowest is $0.0485 on .
100% level: the latest reading is $61,765, on . The highest reading since is $126,236 on ; the lowest is $0.0100 on .
Readings since Jul 17, 2010 let you compare Oct 20, 2026 with earlier months. Highest and lowest cover every reading shown; month-end values use the last reading on or before that date. Every figure here is the published daily reading at Previous 100 candles, period 100, beside Bitcoin's own close on the same day. Change the interval or the settings on the chart above and the chart is recalculated in your browser, but this record is not. How Maketo measures the Bitcoin price.
What are the latest, highest and lowest readings?
| Measure | Latest | Highest | Lowest |
|---|---|---|---|
| Bitcoin price | $82,946 | $123,334 | $0.0495 |
| 0% level | $87,396 | $126,236 | $0.1900 |
| 23.6% level | $81,347 | $121,250 | $0.1475 |
| 38.2% level | $77,605 | $118,166 | $0.1212 |
| 50% level | $74,580 | $115,673 | $0.1000 |
| 61.8% level | $71,556 | $117,933 | $0.0788 |
| 78.6% level | $67,250 | $121,584 | $0.0485 |
| 100% level | $61,765 | $126,236 | $0.0100 |
How do the readings compare with earlier dates?
| Reference date | Bitcoin price | 0% level | 23.6% level | 38.2% level | 50% level | 61.8% level | 78.6% level | 100% level |
|---|---|---|---|---|---|---|---|---|
| 1 month ago | $78,189 | $82,285 | $76,492 | $72,909 | $70,013 | $67,116 | $62,993 | $57,740 |
| 3 months ago | $64,682 | $57,740 | $63,663 | $67,327 | $70,289 | $73,250 | $77,467 | $82,838 |
| 6 months ago | $75,718 | $60,000 | $68,952 | $74,490 | $78,966 | $83,442 | $89,815 | $97,932 |
| 1 year ago | $108,197 | $104,500 | $109,630 | $112,803 | $115,368 | $117,933 | $121,584 | $126,236 |
| 2 years ago | $69,023 | $49,025 | $53,983 | $57,050 | $59,529 | $62,008 | $65,537 | $70,033 |
What was the reading at each month’s end?
| Reading date | Bitcoin price | 0% level | 23.6% level | 38.2% level | 50% level | 61.8% level | 78.6% level | 100% level |
|---|---|---|---|---|---|---|---|---|
| $83,463 | $87,396 | $80,397 | $76,067 | $72,568 | $69,068 | $64,086 | $57,740 | |
| $77,682 | $81,479 | $75,876 | $72,411 | $69,609 | $66,808 | $62,820 | $57,740 | |
| $65,341 | $57,740 | $63,663 | $67,327 | $70,289 | $73,250 | $77,467 | $82,838 | |
| $59,490 | $58,035 | $63,889 | $67,510 | $70,436 | $73,363 | $77,530 | $82,838 | |
| $73,771 | $82,838 | $78,042 | $75,075 | $72,678 | $70,280 | $66,866 | $62,518 | |
| $77,632 | $60,000 | $68,775 | $74,204 | $78,592 | $82,979 | $89,226 | $97,183 | |
| $66,345 | $60,000 | $68,952 | $74,490 | $78,966 | $83,442 | $89,815 | $97,932 | |
| $65,870 | $60,000 | $68,952 | $74,490 | $78,966 | $83,442 | $89,815 | $97,932 | |
| $84,192 | $80,569 | $89,025 | $94,256 | $98,484 | $102,712 | $108,732 | $116,400 | |
| $87,329 | $80,569 | $91,346 | $98,013 | $103,402 | $108,791 | $116,463 | $126,236 | |
| $91,328 | $80,569 | $91,346 | $98,013 | $103,402 | $108,791 | $116,463 | $126,236 | |
| $108,310 | $103,522 | $108,883 | $112,199 | $114,879 | $117,559 | $121,375 | $126,236 | |
| $109,008 | $124,509 | $118,303 | $114,463 | $111,361 | $108,258 | $103,840 | $98,213 | |
| $111,258 | $124,509 | $118,303 | $114,463 | $111,361 | $108,258 | $103,840 | $98,213 | |
| $117,835 | $123,229 | $114,240 | $108,679 | $104,184 | $99,690 | $93,291 | $85,140 | |
| $107,370 | $111,990 | $103,135 | $97,657 | $93,229 | $88,801 | $82,498 | $74,468 | |
| $108,958 | $111,990 | $103,135 | $97,657 | $93,229 | $88,801 | $82,498 | $74,468 | |
| $94,264 | $74,468 | $82,729 | $87,840 | $91,970 | $96,101 | $101,982 | $109,473 | |
| $87,421 | $76,600 | $84,358 | $89,157 | $93,037 | $96,916 | $102,438 | $109,473 | |
| $91,544 | $109,473 | $104,574 | $101,543 | $99,093 | $96,644 | $93,156 | $88,714 | |
| $102,079 | $109,473 | $99,025 | $92,561 | $87,337 | $82,112 | $74,675 | $65,200 | |
| $92,710 | $108,365 | $96,691 | $89,470 | $83,633 | $77,796 | $69,486 | $58,901 | |
| $97,954 | $99,694 | $88,565 | $81,680 | $76,116 | $70,552 | $62,629 | $52,538 | |
| $67,982 | $49,025 | $53,983 | $57,050 | $59,529 | $62,008 | $65,537 | $70,033 |
Keep exploring


Source: Calculated by Maketo on one combined spot market, daily candles. Reading for .