

BITCOIN DONCHIAN CHANNELS
Has price reached the edge of its recent range?
Falling, at $83,469. As of Oct 20, 2026.
Bitcoin Donchian Channels
Daily candles
1D candles. Last closed candle: 2026-10-20 00:00:00 UTC.
Drag to zoom, shift and drag to pan. Click the chart before scrolling to zoom with the wheel, and press Escape to let the page scroll again. The candle interval changes the calculation; the range buttons change only the dates on screen.
Donchian Channels mark the highest high and lowest low of a chosen window. This page uses the previous completed window as the reference so a current crossing can actually be observed. Pick a candle interval and the chart recalculates.
Change the calculation
The last twelve readings as a table
| Candle start, UTC | Channel middle |
|---|---|
| 2026-08-06 00:00:00 UTC | $64,570.38 |
| 2026-08-14 00:00:00 UTC | $63,960.95 |
| 2026-08-21 00:00:00 UTC | $67,804.12 |
| 2026-08-28 00:00:00 UTC | $71,877.65 |
| 2026-09-05 00:00:00 UTC | $72,472.5 |
| 2026-09-12 00:00:00 UTC | $78,922.25 |
| 2026-09-20 00:00:00 UTC | $78,599.22 |
| 2026-09-27 00:00:00 UTC | $81,154.55 |
| 2026-10-04 00:00:00 UTC | $81,154.55 |
| 2026-10-12 00:00:00 UTC | $83,803.57 |
| 2026-10-19 00:00:00 UTC | $83,469 |
| 2026-10-20 00:00:00 UTC | $83,469 |
Quote this chart
The image is of the chart as you have it. The link is to the page, which opens on the published reading, so the sentence above is what tells a reader which interval and formula the quotation was taken on.
Maketo. Bitcoin Donchian Channels (donchian; period 20), 1D candles, Maketo combined market. Last closed candle: 2026-10-20 00:00:00 UTC. Calculation version 1.0.0. https://maketo.com/technical-indicators/donchian-channels
Source: <a href="https://maketo.com/technical-indicators/donchian-channels">Maketo Bitcoin Donchian Channels</a>
RIGHT NOW
Falling, at $83,469. As of Oct 20, 2026.
What the day shows
At the 2026-10-20 UTC close, the reading was 83,469. The previous available reading was 83,469. These lines mark the highest and lowest prices from the preceding completed days. The selected period is 20 daily candles.
How to read that number
A crossing records a fresh break beyond the prior window. The width shows how large that window’s total high-low range was.
What it was read at
Donchian channels, period 20, on daily candles. Change the interval or the settings on the chart above and every number there is recalculated in your browser. This sentence keeps the daily reading the page is published on.
Understanding
Bitcoin Donchian Channels
Where it stands today
Donchian Channels: falling, at $83,469 as of .
What is Bitcoin Donchian Channels?
Donchian Channels mark the highest high and lowest low in a chosen block of prior candles. Their middle line is halfway between those extremes. Their boundaries follow the observed extremes, while the middle gives those two extremes equal influence.Maketo’s default window is 20 candles, and the current candle is excluded from its own channel. The line shown beside a candle is calculated from the preceding 20 candles. This timing detail matters: it lets the current high or low cross a previously established boundary rather than moving the boundary to include itself immediately.
A flat boundary preserves an older extreme
The upper line stays unchanged while its highest high remains in the selected window and no newer candle exceeds it. A flat line therefore does not mean the market stopped moving. It means the same earlier high still defines that side of the channel.
A step can come from an observation leaving
The upper boundary can drop when an old high leaves the window, even if current price barely changes. The lower boundary can rise when an old low drops out. Channel narrowing can reflect the ageing of extremes as well as quieter recent trading.
Distinguish crossing the boundary from closing beyond it
A candle’s high above the preceding upper boundary establishes a new window high, but its close may finish back inside. Those are different observations. Maketo’s direction label instead compares the close with the middle and checks whether the middle has risen or fallen over five candles.
How Donchian Channels is calculated
The upper line is the maximum high of the previous 20 candles, the lower line their minimum low, and the center their midpoint. The page is published on Donchian channels, period 20. A period counts candles at the interval you choose, so the same setting covers a different stretch of time on a one-hour chart than on a daily one. How smoothing and missing candles are handled.
A calculation you can follow
For a small illustrative five-candle window, suppose the preceding highs are $101,000, $104,000, $103,000, $102,000 and $103,500. The lowest low across those candles is $97,000. The upper boundary for the next candle is $104,000, the largest of those highs.The lower boundary is $97,000. The middle is ($104,000 + $97,000) / 2 = $100,500.If the next candle reaches $105,000 but closes at $103,000, its high crossed the old boundary while its close remained below it.That $105,000 high enters the channel used for the following candle. It does not rewrite the boundary that was available before the move.The example separates a previously known level from the later price that tested it. Keeping this order prevents a chart from appearing to know an extreme before it happened.
Lookback period
The default is the preceding 20 selected candles. A longer window retains older highs and lows longer. It generally creates a wider or equal range when comparing windows ending at the same prior candle, but its middle can move in either direction.
Candle interval
Twenty daily candles and twenty hourly candles use different observed extremes. The intraday path disappears when prices are combined into daily candles, although each daily high and low preserve that day’s outermost prices.
Current-candle exclusion
One extra candle is needed beyond the lookback to display the first channel alongside a current observation. With period 20, the first plotted result accompanies the twenty-first candle in a complete run.
An extreme is not an average paid
The highest high could represent very little traded volume. Donchian gives it the same boundary-setting role whether a few BTC or many BTC traded there. The channel contains no information about the amount of activity at each price.
Changing windows can change the story
A close may be above a short window’s upper boundary but still inside a longer window. Both can be correct. State the period and candle interval when citing a new high, low or channel crossing so another reader can reproduce it.
Donchian Channels compared with Keltner Channels
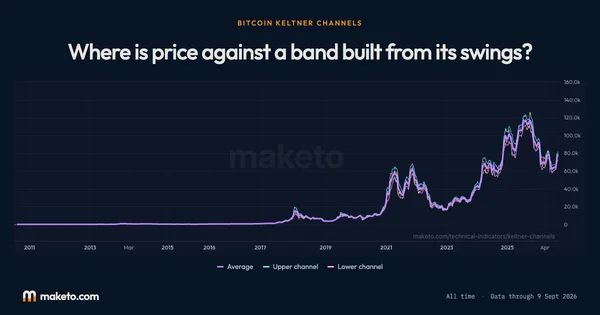
Keltner Channels place a measured range around an average. Donchian uses observed extremes directly. A single isolated high can hold the Donchian upper line in place until it leaves the window, while its influence on a smoothed Keltner channel fades gradually. Open Bitcoin Keltner Channels.
Why is the current high sometimes above the upper channel?
The current candle is deliberately excluded from its own boundary. A high above that line exceeds the previous window’s maximum. The new high can affect the following candle’s channel.
Is the middle an average of closing prices?
No. It is the midpoint between the highest high and lowest low. Prices may have spent almost no time at that midpoint, and it can differ substantially from an average close.
Why did the upper line fall without a large price drop?
The earlier highest high may have aged out of the rolling window. The next-highest observation then becomes the boundary. That is a change in the reference window, not necessarily a sudden new fall.
The numbers
behind the chart
What does the current reading show?
Bitcoin price: the latest reading is $82,946, on . The highest reading since is $123,325 on ; the lowest is $0.0495 on .
Channel middle: the latest reading is $83,469, on . The highest reading since is $118,210 on ; the lowest is $0.0490 on .
Previous highs: the latest reading is $87,229, on . The highest reading since is $126,236 on ; the lowest is $0.0690 on .
Previous lows: the latest reading is $79,709, on . The highest reading since is $112,002 on ; the lowest is $0.0100 on .
Readings since Jul 17, 2010 let you compare Oct 20, 2026 with earlier months. Highest and lowest cover every reading shown; month-end values use the last reading on or before that date. Every figure here is the published daily reading at Donchian channels, period 20, beside Bitcoin's own close on the same day. Change the interval or the settings on the chart above and the chart is recalculated in your browser, but this record is not. How Maketo measures the Bitcoin price.
What are the latest, highest and lowest readings?
| Measure | Latest | Highest | Lowest |
|---|---|---|---|
| Bitcoin price | $82,946 | $123,325 | $0.0495 |
| Channel middle | $83,469 | $118,210 | $0.0490 |
| Previous highs | $87,229 | $126,236 | $0.0690 |
| Previous lows | $79,709 | $112,002 | $0.0100 |
How do the readings compare with earlier dates?
| Reference date | Bitcoin price | Channel middle | Previous highs | Previous lows |
|---|---|---|---|---|
| 1 month ago | $81,164 | $78,599 | $82,285 | $74,913 |
| 3 months ago | $64,717 | $61,402 | $65,064 | $57,740 |
| 6 months ago | $75,718 | $71,671 | $78,364 | $64,978 |
| 1 year ago | $110,784 | $115,368 | $126,236 | $104,500 |
| 2 years ago | $68,365 | $63,951 | $69,000 | $58,901 |
What was the reading at each month’s end?
| Reading date | Bitcoin price | Channel middle | Previous highs | Previous lows |
|---|---|---|---|---|
| $84,462 | $81,155 | $87,396 | $74,913 | |
| $77,842 | $71,878 | $81,265 | $62,490 | |
| $64,723 | $64,344 | $66,924 | $61,765 | |
| $58,532 | $62,650 | $67,264 | $58,035 | |
| $77,260 | $78,520 | $82,838 | $74,203 | |
| $77,632 | $73,047 | $79,486 | $66,607 | |
| $66,381 | $70,815 | $76,012 | $65,619 | |
| $67,991 | $66,627 | $73,254 | $60,000 | |
| $89,193 | $91,985 | $97,932 | $86,037 | |
| $87,914 | $89,523 | $94,620 | $84,425 | |
| $90,815 | $94,030 | $107,491 | $80,569 | |
| $108,310 | $113,048 | $122,573 | $103,522 | |
| $112,011 | $113,632 | $117,939 | $109,325 | |
| $110,123 | $117,581 | $124,509 | $110,653 | |
| $117,941 | $115,331 | $123,229 | $107,434 | |
| $107,077 | $104,416 | $110,619 | $98,213 | |
| $107,797 | $104,436 | $111,990 | $96,882 | |
| $94,264 | $85,208 | $95,813 | $74,604 | |
| $82,385 | $82,685 | $88,771 | $76,600 | |
| $96,562 | $96,871 | $102,535 | $91,207 | |
| $104,733 | $99,305 | $109,473 | $89,138 | |
| $99,402 | $99,821 | $108,365 | $91,278 | |
| $93,006 | $83,576 | $99,694 | $67,457 | |
| $67,982 | $64,205 | $69,509 | $58,901 |
Keep exploring



Source: Calculated by Maketo on one combined spot market, daily candles. Reading for .