

BITCOIN FORCE INDEX
How large is the move after allowing for trading activity?
Falling, at −90,844. As of Oct 20, 2026.
Bitcoin Force Index
Daily candles
1D candles. Last closed candle: 2026-10-20 00:00:00 UTC.
Drag to zoom, shift and drag to pan. Click the chart before scrolling to zoom with the wheel, and press Escape to let the page scroll again. The candle interval changes the calculation; the range buttons change only the dates on screen.
Force Index multiplies the dollar price change by the amount traded. It describes a signed combination of movement and activity. Pick a candle interval and the chart recalculates.
Change the calculation
The last twelve readings as a table
| Candle start, UTC | Force index |
|---|---|
| 2026-08-05 00:00:00 UTC | 293,025.64 USD·BTC |
| 2026-08-13 00:00:00 UTC | -2,972,768.22 USD·BTC |
| 2026-08-20 00:00:00 UTC | 82,451,965.47 USD·BTC |
| 2026-08-28 00:00:00 UTC | 41,591,854.84 USD·BTC |
| 2026-09-04 00:00:00 UTC | 26,069,725.7 USD·BTC |
| 2026-09-12 00:00:00 UTC | 2,158,259.36 USD·BTC |
| 2026-09-19 00:00:00 UTC | 25,824,477.44 USD·BTC |
| 2026-09-27 00:00:00 UTC | 20,395,914.76 USD·BTC |
| 2026-10-04 00:00:00 UTC | 10,904,129.27 USD·BTC |
| 2026-10-12 00:00:00 UTC | -14,257,441.65 USD·BTC |
| 2026-10-19 00:00:00 UTC | -5,198,145.03 USD·BTC |
| 2026-10-20 00:00:00 UTC | -90,843.59 USD·BTC |
Quote this chart
The image is of the chart as you have it. The link is to the page, which opens on the published reading, so the sentence above is what tells a reader which interval and formula the quotation was taken on.
Maketo. Bitcoin Force Index (force; period 13), 1D candles, Maketo combined market. Last closed candle: 2026-10-20 00:00:00 UTC. Calculation version 1.0.0. https://maketo.com/technical-indicators/force-index
Source: <a href="https://maketo.com/technical-indicators/force-index">Maketo Bitcoin Force Index</a>
RIGHT NOW
Falling, at −90,844. As of Oct 20, 2026.
What the day shows
At the 2026-10-20 UTC close, the reading was -90,843.6. The previous available reading was -5.19815e+06. This combines the daily price change with traded Bitcoin, then smooths the result. The selected period is 13 daily candles.
How to read that number
Above zero means upward moves dominate after volume weighting and smoothing. A smaller positive reading means that combined force has eased.
What it was read at
Force index, period 13, on daily candles. Change the interval or the settings on the chart above and every number there is recalculated in your browser. This sentence keeps the daily reading the page is published on.
Understanding
Bitcoin Force Index
Where it stands today
Force Index: falling, at −90,844 as of .
What is Bitcoin Force Index?
Force Index measures each closing-price change in dollars and multiplies it by the candle’s BTC volume. A price rise gives a positive contribution; a decline gives a negative one. A larger move or more volume increases the size of the contribution. Maketo then smooths those values with an exponential average, using 13 candles by default.The raw formula is (current close − preceding close) × volume. The smoothed line retains some influence from earlier positive and negative contributions, so it can remain above zero during a small decline or below zero during a small rise. That persistence comes from the average, not from hidden information about traders.The unit is dollar price change multiplied by BTC volume, displayed as USD·BTC. This is a constructed measure of price movement and activity. It is not dollar trading volume: that would use the actual prices at which trades occurred, not the change between two closing prices. It also does not measure net money entering Bitcoin.
The sign describes the smoothed balance
A positive value means positive price-change-and-volume contributions outweigh negative ones under the average’s weights. A negative value means the reverse. Maketo labels the smoothed line Rising above zero, Falling below zero, and Mixed at zero. This classification uses the level relative to zero, not whether the line increased in the latest candle.
Level and slope answer different questions
A positive value that is falling still shows a positive weighted balance, but a smaller one. A negative value moving toward zero still shows a negative balance, but a smaller one. Keeping those statements separate avoids interpreting every downward bend as a negative reading.
Separate price movement from trading amount
A large raw contribution can come from a large price change, unusually heavy trading, or both. Comparing the price chart and volume histogram tells you which component mattered. The Force Index value alone cannot distinguish those cases.
How Force Index is calculated
Raw force = (close − previous close) × base volume. The default displayed series is a 13-period exponential average of raw force. The page is published on Force index, period 13. A period counts candles at the interval you choose, so the same setting covers a different stretch of time on a one-hour chart than on a daily one. How smoothing and missing candles are handled.
A calculation you can follow
These illustrative values show equal and opposite raw contributions followed by a separate smoothing example. A candle’s close rises by $200 and its volume is 50 BTC. Raw Force Index is $200 × 50 = +10,000 USD·BTC.Another candle’s close falls by $50 with 200 BTC of volume. Its raw value is −$50 × 200 = −10,000 USD·BTC. Four times the volume offsets the four-times-smaller price change.A 13-period exponential average gives a new raw value weight 2 ÷ 14, or one seventh. The remaining six sevenths belong to the preceding smoothed value.If that preceding value is +7,000 and the new raw value is −7,000, the updated value is (6/7 × 7,000) + (1/7 × −7,000) = +5,000. The line declined but remained positive.The current candle can contribute negatively while the smoothed reading remains positive. Reporting both the sign and whether its size increased makes the interpretation more precise.
Smoothing period
Maketo seeds the exponential average with the simple average of its first complete set of raw contributions. The 13-period default needs 13 price changes, so it needs 14 consecutive candles with volume. A shorter period responds faster; a longer one spreads earlier contributions over more time.
Interval and price scale
Thirteen hourly contributions are different from thirteen daily contributions. Also, an equal percentage move creates a larger dollar change at a higher Bitcoin price. Force Index therefore cannot be compared across distant price levels as though it were normalized for Bitcoin’s price.
Zero does not mean no trades
An unchanged close makes the raw contribution zero even when volume is large or price travelled widely inside the candle. After smoothing, earlier values can still keep the line away from zero. The close-to-close rule discards the candle’s internal path.
The name does not establish a cause
The calculation combines recorded price changes and activity. It cannot identify which participants caused a move, whether their orders will continue, or whether a large contribution will be followed by another in the same direction.
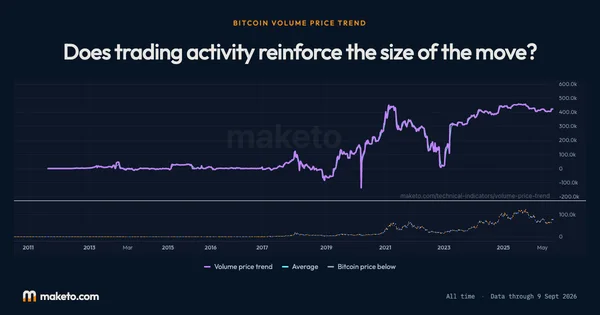
Force Index compared with Volume Price Trend
Volume Price Trend uses fractional price changes and adds them into a running total. Force Index uses dollar changes and applies an exponential average. The first is sensitive to returns and its starting history; the second is sensitive to the dollar price scale and its smoothing period. Open Bitcoin Volume Price Trend.
Is a larger Force Index always a stronger percentage price move?
No. More volume can increase the result even with a smaller percentage move. A higher starting price also makes the same percentage change larger in dollars. Inspect the underlying price change and volume before comparing magnitude.
Does negative Force Index measure seller-initiated volume?
No. It signs volume using the closing-price change. Actual trade direction requires a separate classification of each trade’s initiating side; the candle calculation does not contain that information.
The numbers
behind the chart
What does the current reading show?
Bitcoin price: the latest reading is $82,946, on . The highest reading since is $122,274 on ; the lowest is $0.0495 on .
Force index: the latest reading is −90,844, on . The highest reading since is 302,102,993 on ; the lowest is −313,408,986 on .
Readings since Jul 17, 2010 let you compare Oct 20, 2026 with earlier months. Highest and lowest cover every reading shown; month-end values use the last reading on or before that date. Every figure here is the published daily reading at Force index, period 13, beside Bitcoin's own close on the same day. Change the interval or the settings on the chart above and the chart is recalculated in your browser, but this record is not. How Maketo measures the Bitcoin price.
What are the latest, highest and lowest readings?
| Measure | Latest | Highest | Lowest |
|---|---|---|---|
| Bitcoin price | $82,946 | $122,274 | $0.0495 |
| Force index | −90,844 | 302,102,993 | −313,408,986 |
How do the readings compare with earlier dates?
| Reference date | Bitcoin price | Force index |
|---|---|---|
| 1 month ago | $81,235 | 25,824,477 |
| 3 months ago | $64,989 | 11,302,913 |
| 6 months ago | $74,815 | 24,936,785 |
| 1 year ago | $107,197 | −79,847,756 |
| 2 years ago | $67,617 | 37,809,018 |
What was the reading at each month’s end?
| Reading date | Bitcoin price | Force index |
|---|---|---|
| $84,462 | 20,395,915 | |
| $77,842 | 41,591,855 | |
| $63,901 | −3,922,263 | |
| $60,164 | −13,780,737 | |
| $73,771 | −11,251,222 | |
| $76,327 | 1,976,246 | |
| $68,250 | 1,418,204 | |
| $67,627 | −12,126,315 | |
| $84,192 | −37,760,136 | |
| $87,568 | −2,720,049 | |
| $88,279 | −60,783,555 | |
| $111,658 | −21,951,018 | |
| $109,008 | −29,544,804 | |
| $111,780 | −15,381,749 | |
| $119,452 | 2,524,498 | |
| $107,077 | 12,852,244 | |
| $107,797 | 6,523,953 | |
| $94,264 | 39,326,057 | |
| $82,385 | −14,413,530 | |
| $84,330 | −109,512,309 | |
| $103,740 | 24,007,282 | |
| $92,710 | −35,141,922 | |
| $96,425 | 43,432,378 | |
| $70,262 | 17,272,289 |
Keep exploring



Source: Calculated by Maketo on one combined spot market, daily candles. Reading for .