

BITCOIN VOLUME PRICE TREND
Does trading activity reinforce the size of the move?
Mixed, at 425,387. As of Oct 20, 2026.
Bitcoin Volume Price Trend
Daily candles
1D candles. Last closed candle: 2026-10-20 00:00:00 UTC.
Drag to zoom, shift and drag to pan. Click the chart before scrolling to zoom with the wheel, and press Escape to let the page scroll again. The candle interval changes the calculation; the range buttons change only the dates on screen.
VPT accumulates volume multiplied by the close-to-close percentage move. Larger percentage moves contribute more than smaller moves with equal volume. Pick a candle interval and the chart recalculates.
Change the calculation
The last twelve readings as a table
| Candle start, UTC | Volume price trend |
|---|---|
| 2026-08-05 00:00:00 UTC | 405,233.48 BTC |
| 2026-08-13 00:00:00 UTC | 404,790.8 BTC |
| 2026-08-20 00:00:00 UTC | 414,452.38 BTC |
| 2026-08-28 00:00:00 UTC | 421,052.98 BTC |
| 2026-09-04 00:00:00 UTC | 422,471.58 BTC |
| 2026-09-12 00:00:00 UTC | 421,627.8 BTC |
| 2026-09-19 00:00:00 UTC | 424,039.69 BTC |
| 2026-09-27 00:00:00 UTC | 427,318.82 BTC |
| 2026-10-04 00:00:00 UTC | 427,524.58 BTC |
| 2026-10-12 00:00:00 UTC | 425,011.3 BTC |
| 2026-10-19 00:00:00 UTC | 425,013.66 BTC |
| 2026-10-20 00:00:00 UTC | 425,386.97 BTC |
Quote this chart
The image is of the chart as you have it. The link is to the page, which opens on the published reading, so the sentence above is what tells a reader which interval and formula the quotation was taken on.
Maketo. Bitcoin Volume Price Trend (vpt; period 20), 1D candles, Maketo combined market. Last closed candle: 2026-10-20 00:00:00 UTC. Calculation version 1.0.0. https://maketo.com/technical-indicators/volume-price-trend
Source: <a href="https://maketo.com/technical-indicators/volume-price-trend">Maketo Bitcoin Volume Price Trend</a>
RIGHT NOW
Mixed, at 425,387. As of Oct 20, 2026.
What the day shows
At the 2026-10-20 UTC close, the reading was 425,387. The previous available reading was 425,014. This combines the percentage change in price with the amount of Bitcoin traded. The selected period is 20 daily candles.
How to read that number
A rising line describes positive price changes carrying larger volume-weighted contributions. Compare it with OBV to see the effect of weighting by move size.
What it was read at
Volume price trend, period 20, on daily candles. Change the interval or the settings on the chart above and every number there is recalculated in your browser. This sentence keeps the daily reading the page is published on.
Understanding
Bitcoin Volume Price Trend
Where it stands today
Volume Price Trend: mixed, at 425,387 as of .
What is Bitcoin Volume Price Trend?
Volume Price Trend, or VPT, combines the amount of Bitcoin traded with the percentage change in closing price. Each candle contributes its BTC volume multiplied by its fractional close-to-close return. The contributions are added into a running line, so both the direction and the size of the price move affect the result.The increment is volume × (current close ÷ preceding close − 1). A 2% price rise uses a multiplier of 0.02, not 2. This distinction matters: using the displayed percentage number without dividing by 100 makes the result one hundred times too large. The running line begins with a zero contribution for the first available candle because no preceding close exists in that run.Maketo displays an exponential average of the running line with a default period of 20 candles. VPT’s unit is BTC scaled by fractional returns. That unit comes from the arithmetic; it does not mean the resulting number is an observed quantity of Bitcoin purchased or sold. The sign comes from closing prices rather than the direction of individual trades.
A larger move receives a larger weight
For the same trading volume, a 2% rise adds twice as much as a 1% rise. For the same return, twice the volume also doubles the contribution. Either ingredient can explain a large change in the running line. Inspect both before attributing it to unusually heavy trading.
Read the line against its own recent path
Maketo labels VPT Rising when it is above its exponential average and above its level five candles earlier. Both comparisons must point down for Falling; disagreement produces Mixed. This evaluates recent behavior without assuming that the cumulative zero is an economically meaningful boundary.
A lower line can coexist with a higher price
The weighted negative contributions can exceed the weighted positive contributions even if the final price is above where it began. Returns occur on changing price bases, and volumes vary between candles. The calculation is a summary of those combinations, not another way of calculating Bitcoin’s total return.
How Volume Price Trend is calculated
Each candle adds volume × (close / previous close − 1). The running total starts at the beginning of the available history. The page is published on Volume price trend, period 20. A period counts candles at the interval you choose, so the same setting covers a different stretch of time on a one-hour chart than on a daily one. How smoothing and missing candles are handled.
A calculation you can follow
This illustrative two-change example starts VPT at zero and separates the fractional return from its volume weight. Bitcoin’s close rises from $100,000 to $102,000 while 1,000 BTC trades. The fractional return is 102,000 ÷ 100,000 − 1 = 0.02.The contribution is 1,000 × 0.02 = +20 weighted BTC. VPT becomes 20.The next close falls by 1%, from $102,000 to $100,980, with 500 BTC traded. Its contribution is 500 × −0.01 = −5 weighted BTC.The running result is 15. OBV applied to the same two changes would add 1,000 and subtract 500, giving a change of 500 instead, because it uses direction without scaling by the return.VPT shows that the first candle’s combination of return and volume outweighed the second’s. Neither 15 weighted BTC nor OBV’s 500 is a measurement of actual net Bitcoin purchases.
Average period versus accumulated history
The default 20 controls the exponential average, not a rolling VPT total. Shortening it makes the comparison line respond sooner. The cumulative history continues across the available uninterrupted run; changing the start can shift the level.
Why candle interval matters
Volume multiplied by a daily return is not generally equal to the sum of hourly volume multiplied by hourly returns. Changing the interval changes both the return assigned to the volume and the number of observations. Keep the interval and source coverage fixed for numerical comparisons.
The units are easy to overinterpret
A VPT increment of 20 comes from volume multiplied by a return. It does not show 20 BTC of buyer-initiated trades, 20 new coins entering circulation, or a 20 BTC change in holdings. Those would require different data.
A long-running total has an arbitrary baseline
A large negative historical level can rise steadily, and a large positive one can fall steadily. Judge the change and the average comparison rather than labelling the whole history from the sign of its accumulated value.
Volume Price Trend compared with On-Balance Volume
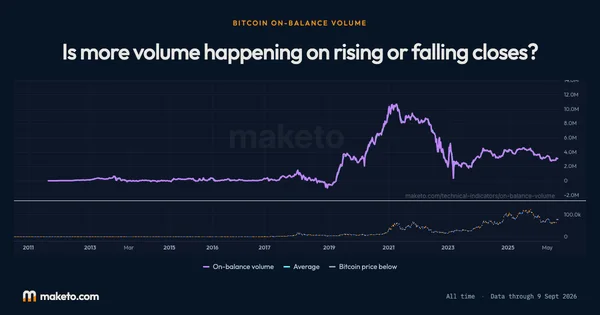
OBV gives equal weight to equal volumes on any positive close, however small the gain. VPT scales the contribution by the fractional price change. Their disagreements reveal the effect of move size rather than a conflict over which trades occurred. Open Bitcoin On-Balance Volume.
Is Volume Price Trend the same as Force Index?
No. VPT uses fractional price change and accumulates the contributions. Force Index uses the dollar change in price multiplied by volume, then smooths those values. They have different units and different treatment of earlier history.
What happens when the closing price is unchanged?
The fractional return is zero, so the candle contributes zero regardless of its volume. A flat VPT contribution therefore does not mean the market was inactive.
Does a gap count as a zero return?
No. Unknown required history is a gap, not a flat price observation. A valid new continuous run must provide the inputs and enough history for its average and directional comparisons.
The numbers
behind the chart
What does the current reading show?
Bitcoin price: the latest reading is $82,946, on . The highest reading since is $120,576 on ; the lowest is $0.0495 on .
Volume price trend: the latest reading is 425,387, on . The highest reading since is 461,388 on ; the lowest is −82,292 on .
Average: the latest reading is 425,433, on . The highest reading since is 455,721 on ; the lowest is −68,781 on .
Readings since Jul 17, 2010 let you compare Oct 20, 2026 with earlier months. Highest and lowest cover every reading shown; month-end values use the last reading on or before that date. Every figure here is the published daily reading at Volume price trend, period 20, beside Bitcoin's own close on the same day. Change the interval or the settings on the chart above and the chart is recalculated in your browser, but this record is not. How Maketo measures the Bitcoin price.
What are the latest, highest and lowest readings?
| Measure | Latest | Highest | Lowest |
|---|---|---|---|
| Bitcoin price | $82,946 | $120,576 | $0.0495 |
| Volume price trend | 425,387 | 461,388 | −82,292 |
| Average | 425,433 | 455,721 | −68,781 |
How do the readings compare with earlier dates?
| Reference date | Bitcoin price | Volume price trend | Average |
|---|---|---|---|
| 1 month ago | $81,235 | 424,040 | 421,225 |
| 3 months ago | $64,989 | 406,194 | 405,164 |
| 6 months ago | $74,815 | 417,297 | 414,521 |
| 1 year ago | $106,447 | 443,501 | 449,754 |
| 2 years ago | $67,067 | 391,191 | 387,140 |
What was the reading at each month’s end?
| Reading date | Bitcoin price | Volume price trend | Average |
|---|---|---|---|
| $84,462 | 427,319 | 424,545 | |
| $77,842 | 421,053 | 414,796 | |
| $63,901 | 405,323 | 405,653 | |
| $60,164 | 403,182 | 405,668 | |
| $73,771 | 418,588 | 419,673 | |
| $76,327 | 419,112 | 418,237 | |
| $68,250 | 412,991 | 412,625 | |
| $67,971 | 405,937 | 408,607 | |
| $84,192 | 423,985 | 426,755 | |
| $87,568 | 425,311 | 425,689 | |
| $88,279 | 424,935 | 431,332 | |
| $111,658 | 444,053 | 446,471 | |
| $109,008 | 451,746 | 453,376 | |
| $111,780 | 453,220 | 454,234 | |
| $119,452 | 456,207 | 455,721 | |
| $107,077 | 452,777 | 451,867 | |
| $107,797 | 452,935 | 451,497 | |
| $95,028 | 445,540 | 440,184 | |
| $82,633 | 430,206 | 431,484 | |
| $84,674 | 430,506 | 439,521 | |
| $101,314 | 441,743 | 440,196 | |
| $93,650 | 435,460 | 437,842 | |
| $97,475 | 441,973 | 433,478 | |
| $72,338 | 395,506 | 391,138 |
Keep exploring



Source: Calculated by Maketo on one combined spot market, daily candles. Reading for .