

BITCOIN RSI
Are recent gains outweighing losses?
Mixed, at 52.65. As of Oct 20, 2026.
Bitcoin RSI
Daily candles
1D candles. Last closed candle: 2026-10-20 00:00:00 UTC.
Drag to zoom, shift and drag to pan. Click the chart before scrolling to zoom with the wheel, and press Escape to let the page scroll again. The candle interval changes the calculation; the range buttons change only the dates on screen.
RSI compares the size of recent upward closes with downward closes. It describes the balance of the move on a scale from 0 to 100. It does not measure how many people are trading. Pick a candle interval and the chart recalculates.
Change the calculation
The last twelve readings as a table
| Candle start, UTC | RSI |
|---|---|
| 2026-08-05 00:00:00 UTC | 53.212 |
| 2026-08-13 00:00:00 UTC | 45.567 |
| 2026-08-20 00:00:00 UTC | 80.339 |
| 2026-08-28 00:00:00 UTC | 70.819 |
| 2026-09-04 00:00:00 UTC | 66.519 |
| 2026-09-12 00:00:00 UTC | 55.07 |
| 2026-09-19 00:00:00 UTC | 64.206 |
| 2026-09-27 00:00:00 UTC | 65.133 |
| 2026-10-04 00:00:00 UTC | 68.553 |
| 2026-10-12 00:00:00 UTC | 46.926 |
| 2026-10-19 00:00:00 UTC | 48.017 |
| 2026-10-20 00:00:00 UTC | 52.65 |
Quote this chart
The image is of the chart as you have it. The link is to the page, which opens on the published reading, so the sentence above is what tells a reader which interval and formula the quotation was taken on.
Maketo. Bitcoin RSI (wilder; period 14), 1D candles, Maketo combined market. Last closed candle: 2026-10-20 00:00:00 UTC. Calculation version 1.0.0. https://maketo.com/technical-indicators/rsi
Source: <a href="https://maketo.com/technical-indicators/rsi">Maketo Bitcoin RSI</a>
RIGHT NOW
Mixed, at 52.65. As of Oct 20, 2026.
What the day shows
At the 2026-10-20 UTC close, the reading was 52.6499. The previous available reading was 48.0168. This compares the size of recent daily gains with recent daily losses. The selected period is 14 daily candles.
How to read that number
Above 70 means recent gains strongly outweighed losses. Below 30 means losses dominated. A return across a threshold is a different event from merely sitting beyond it.
What it was read at
Wilder RSI, period 14, on daily candles. Change the interval or the settings on the chart above and every number there is recalculated in your browser. This sentence keeps the daily reading the page is published on.
Understanding
Bitcoin RSI
Where it stands today
RSI: mixed, at 52.65 as of .
What is Bitcoin RSI?
Bitcoin RSI, the Relative Strength Index, compares the size of recent closing-price gains with the size of recent losses. It answers whether upward or downward changes have carried more weight. Its 0–100 scale makes that balance easier to compare across different Bitcoin price levels, but it does not measure how expensive Bitcoin is.The default is Wilder RSI with a 14-candle period. Each closing-price change contributes a gain, a loss, or zero. The first average uses 14 changes, requiring 15 closes. Later observations keep 13 parts of the previous average and add one part of the new change. This smoothing retains a fading memory of earlier prices instead of discarding them all after 14 candles.
Read the balance before the boundary
For Wilder and Cutler RSI, 50 means averaged gains and losses are equal. At 75, the average gain is three times the average loss; at 25, the reverse is true. A value above 70 describes a strong imbalance toward gains. It does not establish that the next candle will fall. A persistent rise can keep RSI high for many observations.
Separate the level from its latest change
RSI falling from 80 to 65 means gains still outweigh losses, but less strongly. Price can keep rising while RSI falls if new gains become smaller or recent losses become larger. Conversely, a rise from 20 to 35 describes a less uneven downward balance, even though losses still outweigh gains.
Understand the page’s direction label
Maketo labels RSI at or above 55 Rising, at or below 45 Falling, and between them Mixed. Those are disclosed summary boundaries, not a forecast or the 30/70 chart thresholds. Changing the threshold-crossing view changes its guide lines and event list; it does not reverse the meaning of a high RSI.
How RSI is calculated
Wilder RSI smooths gains and losses over 14 candles. RSI = 100 − 100 / (1 + average gain / average loss). Cutler uses simple averages; Stochastic RSI locates RSI within its own recent range. The page is published on Wilder RSI, period 14. A period counts candles at the interval you choose, so the same setting covers a different stretch of time on a one-hour chart than on a daily one. How smoothing and missing candles are handled.
A calculation you can follow
This simplified arithmetic example uses invented price changes to show one 14-period Wilder RSI update. Across the first 14 changes, suppose gains total $4,200 and losses total $1,400. Divide each total by 14: average gain = $300 and average loss = $100.Use RSI = 100 × average gain ÷ (average gain + average loss). The initial result is 100 × 300 ÷ 400 = 75.If the next completed candle closes $700 lower, its gain is zero and its loss is $700. The updated averages are (13 × 300 + 0) ÷ 14 = $278.57 and (13 × 100 + 700) ÷ 14 = $142.86.The new RSI is approximately 66.10. It crossed below 70, while remaining above 50 and above Maketo’s 55 direction boundary.The crossing describes a weaker upward balance. It neither erases the earlier gains nor specifies what price does next. Calculations use unrounded inputs; the displayed dollar averages above are rounded for readability.
Period and candle interval
Fourteen 1-hour candles and fourteen daily candles describe different stretches of trading. A shorter period gives individual changes more influence. A longer period usually changes more gradually. Comparing settings is useful only when the candle interval and observation time are also clear.
Wilder and Cutler
Cutler RSI uses simple rolling averages of gains and losses. Wilder RSI updates the previous smoothed averages. Cutler therefore drops a change completely when it leaves the window; Wilder lets its influence fade. Identical period numbers do not make these variants identical.
Stochastic RSI
This variant locates Wilder RSI within its own recent highest and lowest values, then smooths that position. Its defaults are RSI 14, range 14, and two 3-period averages. It measures the position of RSI, not the position of Bitcoin’s close inside its price range. Its 45/55 direction boundaries apply to that transformed position, without requiring agreement with the second smoothed line.
A high reading is not a clock
A threshold contains no deadline. Counting repeated observations above 70 as repeated independent events exaggerates what happened; a crossing records a transition across the boundary, not every candle that remains beyond it.
Check flat prices and missing history
Maketo returns 50 when both average gains and losses are zero, 100 when only gains remain, and 0 when only losses remain. Missing candles interrupt calculation. A chart zoom changes the visible range, not the historical starting point used to initialize Wilder smoothing.
RSI compared with Money Flow Index
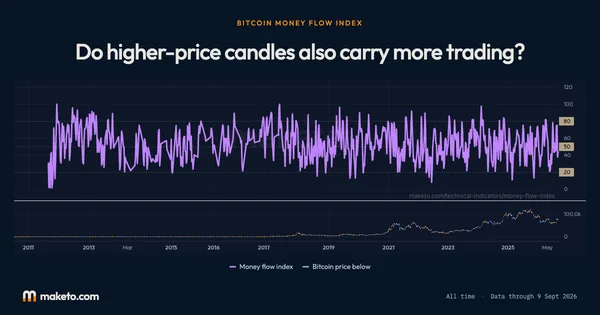
Compare RSI with Money Flow Index, a measure that also uses candle volume. RSI treats equal price changes equally regardless of how much trading occurred. A difference between the two can help explain whether larger or smaller trading totals accompanied the price changes; it does not identify individual traders’ intentions. Open Bitcoin Money Flow Index.
Is Bitcoin RSI a comparison with another asset?
No. Despite its name, RSI compares Bitcoin’s own gains and losses. A relative-performance chart comparing Bitcoin with another asset is a different calculation.
Why can two Bitcoin RSI charts disagree?
Check the candle interval, price market, period, Wilder versus Cutler method, whether the final candle is complete, and the available starting history. Different inputs or initialization can produce different readings even when both charts say RSI 14.
The numbers
behind the chart
What does the current reading show?
Bitcoin price: the latest reading is $82,946, on . The highest reading since is $122,274 on ; the lowest is $0.0495 on .
RSI: the latest reading is 52.65, on . The highest reading since is 94.06 on ; the lowest is 15.24 on .
Readings since Jul 17, 2010 let you compare Oct 20, 2026 with earlier months. Highest and lowest cover every reading shown; month-end values use the last reading on or before that date. Every figure here is the published daily reading at Wilder RSI, period 14, beside Bitcoin's own close on the same day. Change the interval or the settings on the chart above and the chart is recalculated in your browser, but this record is not. How Maketo measures the Bitcoin price.
What are the latest, highest and lowest readings?
| Measure | Latest | Highest | Lowest |
|---|---|---|---|
| Bitcoin price | $82,946 | $122,274 | $0.0495 |
| RSI | 52.65 | 94.06 | 15.24 |
How do the readings compare with earlier dates?
| Reference date | Bitcoin price | RSI |
|---|---|---|
| 1 month ago | $81,235 | 64.21 |
| 3 months ago | $64,989 | 56.27 |
| 6 months ago | $74,815 | 62.55 |
| 1 year ago | $107,197 | 36.71 |
| 2 years ago | $67,617 | 67.69 |
What was the reading at each month’s end?
| Reading date | Bitcoin price | RSI |
|---|---|---|
| $84,462 | 65.13 | |
| $77,842 | 70.82 | |
| $63,901 | 48.57 | |
| $60,164 | 34.33 | |
| $73,771 | 37.44 | |
| $76,327 | 55.59 | |
| $68,250 | 47.20 | |
| $67,627 | 36.69 | |
| $84,192 | 33.57 | |
| $87,568 | 44.79 | |
| $88,279 | 32.51 | |
| $111,658 | 48.35 | |
| $109,008 | 36.04 | |
| $111,780 | 42.49 | |
| $119,452 | 64.10 | |
| $107,077 | 55.40 | |
| $107,797 | 61.20 | |
| $94,264 | 65.49 | |
| $82,385 | 41.87 | |
| $84,330 | 25.45 | |
| $103,740 | 56.94 | |
| $92,710 | 41.57 | |
| $96,425 | 65.64 | |
| $70,262 | 60.87 |
Keep exploring


Source: Calculated by Maketo on one combined spot market, daily candles. Reading for .