

BITCOIN ON-BALANCE VOLUME
Is more volume happening on rising or falling closes?
Falling, at 3,025,354. As of Oct 20, 2026.
Bitcoin On-Balance Volume
Daily candles
1D candles. Last closed candle: 2026-10-20 00:00:00 UTC.
Drag to zoom, shift and drag to pan. Click the chart before scrolling to zoom with the wheel, and press Escape to let the page scroll again. The candle interval changes the calculation; the range buttons change only the dates on screen.
OBV adds the entire candle’s volume when the close rises and subtracts it when the close falls. An unchanged close adds nothing. Pick a candle interval and the chart recalculates.
Change the calculation
The last twelve readings as a table
| Candle start, UTC | On-balance volume |
|---|---|
| 2026-08-05 00:00:00 UTC | 2,891,650.2 BTC |
| 2026-08-13 00:00:00 UTC | 2,839,830.06 BTC |
| 2026-08-20 00:00:00 UTC | 3,011,801.36 BTC |
| 2026-08-28 00:00:00 UTC | 3,125,818.02 BTC |
| 2026-09-04 00:00:00 UTC | 3,101,593.29 BTC |
| 2026-09-12 00:00:00 UTC | 3,073,004.62 BTC |
| 2026-09-19 00:00:00 UTC | 3,175,900.66 BTC |
| 2026-09-27 00:00:00 UTC | 3,171,921.07 BTC |
| 2026-10-04 00:00:00 UTC | 3,129,758.16 BTC |
| 2026-10-12 00:00:00 UTC | 3,006,721.35 BTC |
| 2026-10-19 00:00:00 UTC | 2,997,637.22 BTC |
| 2026-10-20 00:00:00 UTC | 3,025,353.94 BTC |
Quote this chart
The image is of the chart as you have it. The link is to the page, which opens on the published reading, so the sentence above is what tells a reader which interval and formula the quotation was taken on.
Maketo. Bitcoin On-Balance Volume (obv; period 20), 1D candles, Maketo combined market. Last closed candle: 2026-10-20 00:00:00 UTC. Calculation version 1.0.0. https://maketo.com/technical-indicators/on-balance-volume
Source: <a href="https://maketo.com/technical-indicators/on-balance-volume">Maketo Bitcoin On-Balance Volume</a>
RIGHT NOW
Falling, at 3,025,354. As of Oct 20, 2026.
What the day shows
At the 2026-10-20 UTC close, the reading was 3.02535e+06. The previous available reading was 2.99764e+06. This adds traded Bitcoin on rising-close days and subtracts it on falling-close days. The selected period is 20 daily candles.
How to read that number
The recent direction of the line shows whether more volume occurred on rising or falling closes. Its absolute starting number has no special meaning.
What it was read at
On-balance volume, period 20, on daily candles. Change the interval or the settings on the chart above and every number there is recalculated in your browser. This sentence keeps the daily reading the page is published on.
Understanding
Bitcoin On-Balance Volume
Where it stands today
On-Balance Volume: falling, at 3,025,354 as of .
What is Bitcoin On-Balance Volume?
On-Balance Volume, or OBV, keeps a running total of volume signed by the direction of each closing-price change. If Bitcoin closes above the preceding candle, the entire candle’s BTC volume is added. If it closes below, the entire amount is subtracted. If the two closes are equal, that candle adds zero.The calculation deliberately ignores how large the price change was. An increase of $1 and an increase of $1,000 receive the same positive sign when their volume is equal. OBV therefore asks whether more trading activity has accompanied higher or lower closes, rather than measuring the size of Bitcoin’s return.Maketo also plots an exponential average of OBV, using 20 candles by default. The line’s position against that average helps distinguish its recent level from its direction. The raw total uses BTC units, but it is a constructed signed total. It is not the amount held by buyers, an exchange balance, or a count of coins that have entered the market.
Focus on changes, not the starting level
A rising section means the added volume from higher-close candles exceeded the subtracted volume from lower-close candles over that section. A negative total is not intrinsically worse than a positive one: changing the start of the available history can shift the whole line. The subsequent increments are the more portable comparison.
The directional label uses two conditions
Maketo labels OBV Rising when it is above its exponential average and above its own value five candles earlier. Falling requires both comparisons to point down. If they disagree, the reading is Mixed. This prevents the direction label from being based on the arbitrary zero of a cumulative total.
A price disagreement has a specific meaning
Price can rise over several candles while OBV falls if the lower-close candles traded more volume. This says something about how activity was distributed across those candles. It does not establish that informed traders sold, that the price move is false, or that a reversal is due.
How On-Balance Volume is calculated
OBV today = prior OBV + signed base volume, with the sign taken from close versus previous close. The default direction comparison uses 20 candles. The page is published on On-balance volume, period 20. A period counts candles at the interval you choose, so the same setting covers a different stretch of time on a one-hour chart than on a daily one. How smoothing and missing candles are handled.
A calculation you can follow
These illustrative candles use small BTC quantities so the signed total is easy to check. The first available candle’s volume sets Maketo’s initial value. Suppose the first candle closes at $100,000 and records 100 BTC. Maketo starts OBV at 100.The next close is $100,001 with 40 BTC of volume. The close increased, so OBV becomes 140, even though the price gain was only $1.The next close falls to $99,000 with 30 BTC traded. Subtracting that volume gives OBV of 110. The larger dollar decline does not receive a larger price-based weight.A fourth candle also closes at $99,000 and trades 200 BTC. Equal closes add zero, so OBV stays 110 despite that substantial activity.OBV increased by 10 after the initial candle while price ended lower. Its rule measures the balance of volume attached to up and down closes, not a volume-adjusted percentage return.
What the period changes
The 20-candle setting controls the exponential average displayed beside OBV. It does not limit the running total to the last 20 candles. The average starts with a simple average and then gives new values a weight of 2 ÷ (period + 1).
History and interval
Maketo begins each available continuous run with the first candle’s volume. Another implementation may begin at zero, shifting the absolute line. Combining smaller candles also changes which volume receives which sign: one positive daily close can contain both positive and negative hourly closes. Daily OBV is not the sum of hourly signed contributions.
A signed candle is not a signed trade
The method assigns all of a candle’s volume one sign, including trades initiated from both sides. Actual buyer- and seller-initiated volume requires trade-level direction data. OBV is useful as a price-and-volume summary without being a substitute for that data.
Flat closes can hide busy trading
Equal consecutive closes make the contribution zero even if price travelled widely inside the candle. Use the volume histogram and price range when that detail matters; neither appears in OBV’s simple sign rule.
On-Balance Volume compared with Volume Price Trend
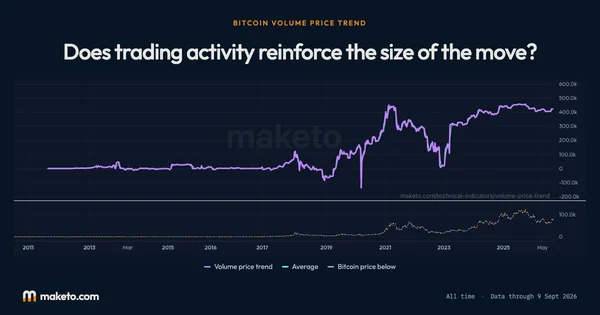
Volume Price Trend multiplies volume by the fractional close-to-close price change. It therefore distinguishes a small rise from a large rise. OBV uses only the sign, making its arithmetic simpler but discarding the magnitude of the return. Open Bitcoin Volume Price Trend.
Can I compare the absolute OBV values of two websites?
Only after matching their starting history, candle interval, and market coverage. Otherwise a different level may reflect an initial offset or a different set of trades, rather than a disagreement about the recent direction.
Why can OBV be unavailable after a missing candle?
A running total cannot safely cross unknown required input. The chart preserves the gap and restarts on the available continuous history; the average and directional reading then need sufficient observations again.
The numbers
behind the chart
What does the current reading show?
Bitcoin price: the latest reading is $82,946, on . The highest reading since is $120,576 on ; the lowest is $0.0495 on .
On-balance volume: the latest reading is 3,025,354, on . The highest reading since is 10,643,653 on ; the lowest is −961,952 on .
Average: the latest reading is 3,043,168, on . The highest reading since is 10,561,152 on ; the lowest is −759,843 on .
Readings since Jul 17, 2010 let you compare Oct 20, 2026 with earlier months. Highest and lowest cover every reading shown; month-end values use the last reading on or before that date. Every figure here is the published daily reading at On-balance volume, period 20, beside Bitcoin's own close on the same day. Change the interval or the settings on the chart above and the chart is recalculated in your browser, but this record is not. How Maketo measures the Bitcoin price.
What are the latest, highest and lowest readings?
| Measure | Latest | Highest | Lowest |
|---|---|---|---|
| Bitcoin price | $82,946 | $120,576 | $0.0495 |
| On-balance volume | 3,025,354 | 10,643,653 | −961,952 |
| Average | 3,043,168 | 10,561,152 | −759,843 |
How do the readings compare with earlier dates?
| Reference date | Bitcoin price | On-balance volume | Average |
|---|---|---|---|
| 1 month ago | $81,235 | 3,175,901 | 3,090,754 |
| 3 months ago | $64,989 | 2,866,197 | 2,843,519 |
| 6 months ago | $74,815 | 3,234,299 | 3,200,596 |
| 1 year ago | $106,447 | 4,165,766 | 4,342,083 |
| 2 years ago | $67,067 | 3,431,427 | 3,344,763 |
What was the reading at each month’s end?
| Reading date | Bitcoin price | On-balance volume | Average |
|---|---|---|---|
| $84,462 | 3,171,921 | 3,131,736 | |
| $77,842 | 3,125,818 | 3,012,454 | |
| $63,901 | 2,871,560 | 2,843,947 | |
| $60,164 | 2,740,428 | 2,816,479 | |
| $73,771 | 3,320,102 | 3,388,611 | |
| $76,327 | 3,350,534 | 3,325,080 | |
| $68,250 | 3,207,397 | 3,195,312 | |
| $67,971 | 3,187,746 | 3,250,826 | |
| $84,192 | 3,570,819 | 3,621,918 | |
| $87,568 | 3,558,098 | 3,588,581 | |
| $88,279 | 3,672,042 | 3,855,461 | |
| $111,658 | 4,205,619 | 4,258,006 | |
| $109,008 | 4,272,736 | 4,318,674 | |
| $111,780 | 4,279,797 | 4,336,204 | |
| $119,452 | 4,518,208 | 4,537,954 | |
| $107,077 | 4,419,302 | 4,391,773 | |
| $107,797 | 4,461,899 | 4,420,210 | |
| $95,028 | 4,323,555 | 4,112,168 | |
| $82,633 | 3,723,270 | 3,803,126 | |
| $84,674 | 3,937,469 | 4,122,331 | |
| $101,314 | 4,277,921 | 4,256,790 | |
| $93,650 | 4,066,661 | 4,143,164 | |
| $97,475 | 4,252,857 | 4,078,274 | |
| $72,338 | 3,554,778 | 3,461,944 |
Keep exploring


Source: Calculated by Maketo on one combined spot market, daily candles. Reading for .