

BITCOIN PIVOT POINTS
Which reference prices come from the last completed candle?
Reference levels, at $82,198. As of Oct 20, 2026.
Bitcoin Pivot Points
Daily candles
1D candles. Last closed candle: 2026-10-20 00:00:00 UTC.
Drag to zoom, shift and drag to pan. Click the chart before scrolling to zoom with the wheel, and press Escape to let the page scroll again. The candle interval changes the calculation; the range buttons change only the dates on screen.
Pivot points turn the previous completed candle’s high, low and close into fixed reference levels for the next candle interval. They are formula-based landmarks. Pick a candle interval and the chart recalculates.
Change the calculation
The last twelve readings as a table
| Candle start, UTC | Pivot |
|---|---|
| 2026-08-06 00:00:00 UTC | $64,473.96 |
| 2026-08-14 00:00:00 UTC | $63,391.75 |
| 2026-08-21 00:00:00 UTC | $71,753.9 |
| 2026-08-28 00:00:00 UTC | $79,889 |
| 2026-09-05 00:00:00 UTC | $79,917.08 |
| 2026-09-12 00:00:00 UTC | $77,698.23 |
| 2026-09-19 00:00:00 UTC | $79,501.05 |
| 2026-09-27 00:00:00 UTC | $84,230.74 |
| 2026-10-04 00:00:00 UTC | $84,735.39 |
| 2026-10-12 00:00:00 UTC | $83,509.77 |
| 2026-10-19 00:00:00 UTC | $81,595.12 |
| 2026-10-20 00:00:00 UTC | $82,197.93 |
Quote this chart
The image is of the chart as you have it. The link is to the page, which opens on the published reading, so the sentence above is what tells a reader which interval and formula the quotation was taken on.
Maketo. Bitcoin Pivot Points (classic), 1D candles, Maketo combined market. Last closed candle: 2026-10-20 00:00:00 UTC. Calculation version 1.0.0. https://maketo.com/technical-indicators/pivot-points
Source: <a href="https://maketo.com/technical-indicators/pivot-points">Maketo Bitcoin Pivot Points</a>
RIGHT NOW
Reference levels, at $82,198. As of Oct 20, 2026.
What the day shows
At the 2026-10-20 UTC close, the reading was 82,197.9. The previous available reading was 81,595.1. These reference prices come from the previous completed day’s high, low and close.
How to read that number
These levels describe where price sits against the previous interval’s structure. Selecting daily candles produces references from the prior completed day.
What it was read at
Classic pivots, on daily candles. Change the interval or the settings on the chart above and every number there is recalculated in your browser. This sentence keeps the daily reading the page is published on.
Understanding
Bitcoin Pivot Points
Where it stands today
Pivot Points: reference levels, at $82,198 as of .
What is Bitcoin Pivot Points?
Pivot Points turn the preceding candle’s high, low, and close into a set of dollar reference levels for the next candle. The central pivot in Maketo’s views is (high + low + close) ÷ 3. The outer levels use the preceding range in different ways. They are calculations from earlier prices, not observed order books or proof that orders are waiting at those prices.The selected interval controls the source candle. On a daily chart, the levels use the preceding UTC day. On an hourly chart, they use the preceding hour; on a monthly chart, the preceding month. This page does not quietly keep daily pivots fixed when you switch to another interval. Matching the source interval is essential when comparing it with another chart.Maketo offers Classic, Fibonacci, and Camarilla variants on one page because they share the same idea and inputs. The variants differ in their placement of outer levels. The page treats all of them as reference levels, without adding an upward or downward vote to the hub.
Classic levels use the pivot and preceding range
Write P for the pivot and R for the preceding high minus low. The first upper level is 2P − low; the first lower level is 2P − high. The second pair is P + R and P − R. The third upper level is high + 2(P − low), and the third lower level is low − 2(high − P). All remain dollar prices.
Fibonacci pivots place symmetric bands around the pivot
The three outer pairs are P ± 0.382R, P ± 0.618R, and P ± R. These levels are symmetric around P. They use ratios of the preceding candle’s range; they do not search the chart for two swing anchors, which is the separate Fibonacci Retracement calculation.
Camarilla levels use a different center
The four outer pairs are preceding close ± 1.1R divided by 12, 6, 4, and 2 respectively. Those pairs are centered on the preceding close, while the separately displayed pivot is still (high + low + close) ÷ 3. The two centers coincide only when the close equals that three-price average.
How Pivot Points is calculated
Classic pivot P = (high + low + close) / 3. The first upper reference is 2P − low and the first lower reference 2P − high. Fibonacci and Camarilla variants use different multiples of the prior range. The page is published on Classic pivots. A period counts candles at the interval you choose, so the same setting covers a different stretch of time on a one-hour chart than on a daily one. How smoothing and missing candles are handled.
A calculation you can follow
Use an illustrative preceding high of $110,000, low of $100,000, and close of $106,000. Rounding below is for explanation; calculations use the unrounded values. The range is $10,000. The central pivot is ($110,000 + $100,000 + $106,000) ÷ 3 = $105,333.33.The first Classic upper level is 2 × $105,333.33 − $100,000 = $110,666.67. The first lower level is $100,666.67. The second pair is $115,333.33 and $95,333.33.The first Fibonacci pair is $105,333.33 ± $3,820, giving $109,153.33 and $101,513.33.The first Camarilla pair is $106,000 ± ($11,000 ÷ 12), or approximately $106,916.67 and $105,083.33. It is centered on the close, not on $105,333.33.All three views use the same preceding candle yet produce different levels. A citation should name the variant and interval instead of describing a single universal Bitcoin pivot price.
Completed source candle
The levels for a candle use its predecessor, so their inputs do not change with ordinary price movement inside the current candle. They update when a new selected-interval candle begins. A correction to the preceding data can still revise them.
How much history is needed
One preceding complete candle provides the source values. Missing history is not replaced with a synthetic candle. Large intervals require a real completed preceding period; the presence of daily history does not automatically provide every earlier annual reference.
Level numbering
Upper and lower labels identify formula positions, not the probability of being reached. A wider preceding range spreads most outer levels farther apart. The same level number on two variants need not refer to the same price or distance.
A calculated line does not demonstrate a floor or ceiling
Price can pass through, stop near, or never approach a pivot level. The formula does not inspect available orders or estimate the chance of any of those outcomes. A previous reaction near a line also does not establish the next one.
Daily pivots depend on the day boundary
A continuous Bitcoin market has no single physical closing auction. Maketo uses UTC candles. A chart with another daily boundary can have different highs, lows, closes, and therefore different pivot levels without either arithmetic being wrong.
Pivot Points compared with Fibonacci Retracement
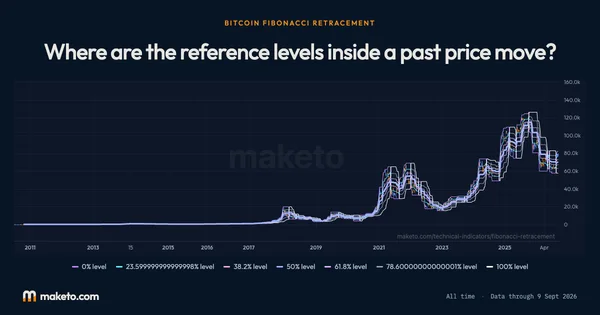
Fibonacci pivots center range multiples on the preceding candle’s pivot. Fibonacci Retracement marks fractions of a move between two anchors. Sharing some ratios does not make the reference prices or the choice of source history equivalent. Open Bitcoin Fibonacci Retracement.
Why did every pivot level change at once?
A new candle of the selected interval brings a new preceding high, low, and close. The whole set is recalculated together. That change can occur even if current price barely moved across the boundary.
Do the levels forecast a closing price?
No. They organize prices derived from a completed period. The calculation has no future-price estimate, target date, or probability attached to any level.
The numbers
behind the chart
What does the current reading show?
Bitcoin price: the latest reading is $82,946, on . The highest reading since is $123,325 on ; the lowest is $0.0495 on .
Pivot: the latest reading is $82,198, on . The highest reading since is $122,389 on ; the lowest is $0.0495 on .
Upper level 1: the latest reading is $82,746, on . The highest reading since is $124,163 on ; the lowest is $0.0495 on .
Lower level 1: the latest reading is $81,296, on . The highest reading since is $119,595 on ; the lowest is $0.0475 on .
Upper level 2: the latest reading is $83,648, on . The highest reading since is $126,958 on ; the lowest is $0.0495 on .
Lower level 2: the latest reading is $80,748, on . The highest reading since is $117,820 on ; the lowest is $0.0374 on .
Upper level 3: the latest reading is $84,196, on . The highest reading since is $128,732 on ; the lowest is $0.0495 on .
Lower level 3: the latest reading is $79,846, on . The highest reading since is $116,300 on ; the lowest is −$0.0063 on .
Readings since Jul 17, 2010 let you compare Oct 20, 2026 with earlier months. Highest and lowest cover every reading shown; month-end values use the last reading on or before that date. Every figure here is the published daily reading at Classic pivots, beside Bitcoin's own close on the same day. Change the interval or the settings on the chart above and the chart is recalculated in your browser, but this record is not. How Maketo measures the Bitcoin price.
What are the latest, highest and lowest readings?
| Measure | Latest | Highest | Lowest |
|---|---|---|---|
| Bitcoin price | $82,946 | $123,325 | $0.0495 |
| Pivot | $82,198 | $122,389 | $0.0495 |
| Upper level 1 | $82,746 | $124,163 | $0.0495 |
| Lower level 1 | $81,296 | $119,595 | $0.0475 |
| Upper level 2 | $83,648 | $126,958 | $0.0495 |
| Lower level 2 | $80,748 | $117,820 | $0.0374 |
| Upper level 3 | $84,196 | $128,732 | $0.0495 |
| Lower level 3 | $79,846 | $116,300 | −$0.0063 |
How do the readings compare with earlier dates?
| Reference date | Bitcoin price | Pivot | Upper level 1 | Lower level 1 | Upper level 2 | Lower level 2 | Upper level 3 | Lower level 3 |
|---|---|---|---|---|---|---|---|---|
| 1 month ago | $81,235 | $79,501 | $82,766 | $77,614 | $84,654 | $74,348 | $87,919 | $72,461 |
| 3 months ago | $64,717 | $64,086 | $65,967 | $63,107 | $66,945 | $61,226 | $68,826 | $60,248 |
| 6 months ago | $75,718 | $76,666 | $78,784 | $74,968 | $80,482 | $72,850 | $82,600 | $71,151 |
| 1 year ago | $110,784 | $112,808 | $115,707 | $110,153 | $118,361 | $107,255 | $121,260 | $104,600 |
| 2 years ago | $68,427 | $67,331 | $68,014 | $66,729 | $68,616 | $66,047 | $69,299 | $65,445 |
What was the reading at each month’s end?
| Reading date | Bitcoin price | Pivot | Upper level 1 | Lower level 1 | Upper level 2 | Lower level 2 | Upper level 3 | Lower level 3 |
|---|---|---|---|---|---|---|---|---|
| $84,462 | $84,231 | $84,673 | $83,991 | $84,912 | $83,549 | $85,354 | $83,309 | |
| $77,842 | $79,889 | $81,225 | $78,930 | $82,185 | $77,593 | $83,521 | $76,634 | |
| $64,723 | $63,925 | $64,641 | $63,185 | $65,382 | $62,468 | $66,098 | $61,728 | |
| $58,532 | $59,895 | $60,971 | $59,087 | $61,779 | $58,011 | $62,855 | $57,203 | |
| $76,980 | $76,058 | $77,912 | $74,809 | $79,161 | $72,954 | $81,015 | $71,705 | |
| $77,632 | $77,768 | $78,259 | $76,958 | $79,068 | $76,467 | $79,559 | $75,658 | |
| $68,800 | $71,247 | $72,097 | $70,468 | $72,876 | $69,619 | $73,726 | $68,840 | |
| $67,991 | $63,858 | $65,199 | $62,718 | $66,339 | $61,378 | $67,679 | $60,238 | |
| $88,299 | $87,301 | $88,565 | $85,353 | $90,513 | $84,089 | $91,777 | $82,141 | |
| $87,914 | $87,667 | $88,122 | $87,386 | $88,403 | $86,932 | $88,857 | $86,651 | |
| $90,897 | $91,118 | $92,147 | $90,299 | $92,966 | $89,271 | $93,995 | $88,451 | |
| $108,310 | $110,951 | $112,730 | $108,249 | $115,432 | $106,471 | $117,211 | $103,769 | |
| $114,057 | $113,456 | $115,339 | $112,455 | $116,340 | $110,571 | $118,224 | $109,571 | |
| $113,484 | $115,654 | $116,769 | $114,293 | $118,130 | $113,177 | $119,245 | $111,816 | |
| $117,941 | $116,943 | $119,168 | $115,400 | $120,711 | $113,175 | $122,936 | $111,632 | |
| $106,983 | $107,125 | $108,404 | $106,091 | $109,438 | $104,812 | $110,717 | $103,779 | |
| $107,797 | $109,081 | $110,636 | $107,404 | $112,314 | $105,849 | $113,869 | $104,171 | |
| $95,028 | $94,248 | $94,863 | $93,144 | $95,967 | $92,528 | $96,583 | $91,424 | |
| $82,385 | $82,958 | $84,279 | $81,311 | $85,926 | $79,990 | $87,247 | $78,344 | |
| $84,330 | $84,792 | $86,918 | $82,548 | $89,162 | $80,421 | $91,288 | $78,177 | |
| $104,733 | $103,279 | $105,250 | $101,769 | $106,760 | $99,798 | $108,731 | $98,288 | |
| $93,479 | $93,033 | $94,644 | $91,099 | $96,578 | $89,489 | $98,189 | $87,555 | |
| $97,954 | $97,954 | $98,732 | $96,945 | $99,740 | $96,167 | $100,518 | $95,159 | |
| $67,053 | $66,983 | $68,412 | $65,210 | $70,185 | $63,781 | $71,614 | $62,008 |
Keep exploring


Source: Calculated by Maketo on one combined spot market, daily candles. Reading for .