

BITCOIN RATE OF CHANGE
How much has price changed over this window?
Rising, at 1.53%. As of Oct 20, 2026.
Bitcoin Rate of Change
Daily candles
1D candles. Last closed candle: 2026-10-20 00:00:00 UTC.
Drag to zoom, shift and drag to pan. Click the chart before scrolling to zoom with the wheel, and press Escape to let the page scroll again. The candle interval changes the calculation; the range buttons change only the dates on screen.
Rate of change compares the latest close with a close a fixed number of candles earlier. It is a direct measure of a move, with no hidden smoothing. Pick a candle interval and the chart recalculates.
Change the calculation
The last twelve readings as a table
| Candle start, UTC | Percentage change |
|---|---|
| 2026-08-05 00:00:00 UTC | 0.803944% |
| 2026-08-13 00:00:00 UTC | 1.053% |
| 2026-08-20 00:00:00 UTC | 12.484% |
| 2026-08-28 00:00:00 UTC | 23.88% |
| 2026-09-04 00:00:00 UTC | 2.497% |
| 2026-09-12 00:00:00 UTC | -1.657% |
| 2026-09-19 00:00:00 UTC | 2.71% |
| 2026-09-27 00:00:00 UTC | 11.744% |
| 2026-10-04 00:00:00 UTC | 0.358521% |
| 2026-10-12 00:00:00 UTC | -2.177% |
| 2026-10-19 00:00:00 UTC | -1.72% |
| 2026-10-20 00:00:00 UTC | 1.534% |
Quote this chart
The image is of the chart as you have it. The link is to the page, which opens on the published reading, so the sentence above is what tells a reader which interval and formula the quotation was taken on.
Maketo. Bitcoin Rate of Change (roc; period 12), 1D candles, Maketo combined market. Last closed candle: 2026-10-20 00:00:00 UTC. Calculation version 1.0.0. https://maketo.com/technical-indicators/rate-of-change
Source: <a href="https://maketo.com/technical-indicators/rate-of-change">Maketo Bitcoin Rate of Change</a>
RIGHT NOW
Rising, at 1.53%. As of Oct 20, 2026.
What the day shows
At the 2026-10-20 UTC close, the reading was 1.53409. The previous available reading was -1.72006. This measures the percentage change from the closing price at the start of the selected period. The selected period is 12 daily candles.
How to read that number
Above zero means the price rose over the selected window; below zero means it fell. A rising ROC can mean gains accelerated or losses slowed.
What it was read at
Rate of change, period 12, on daily candles. Change the interval or the settings on the chart above and every number there is recalculated in your browser. This sentence keeps the daily reading the page is published on.
Understanding
Bitcoin Rate of Change
Where it stands today
Rate of Change: rising, at 1.53% as of .
What is Bitcoin Rate of Change?
Bitcoin Rate of Change compares the latest close with the close a chosen number of candles earlier. It is a direct answer to how much price changed between those two observations. The default uses 12 periods and reports a percentage. There is no smoothing stage and no high-low range in the formula.This simplicity makes Rate of Change useful for checking more elaborate indicators. A positive reading means Bitcoin ended above its earlier comparison close; a negative reading means it ended below. It does not reveal the route between those endpoints. A steady climb and a sharp fall followed by a recovery can produce the same result.
Read it as a change over a named span
A 12-period reading of +5% means the latest close is 5% above the close 12 candles earlier. The elapsed span depends on the candle interval: 12 hourly periods cover 12 hours, while 12 daily periods cover 12 days. The calculation needs both endpoints, so it requires 13 consecutive closes.
Separate the sign from whether the reading is rising
Rate of Change moving from +8% to +5% still describes a higher price than 12 candles earlier. The measured gain has become smaller. Moving from −8% to −5% describes a smaller measured loss. Neither change in the indicator alone tells you whether the latest candle rose or fell.
Know what the direction label summarizes
Maketo’s label follows the sign: above zero is Rising, below zero is Falling, and exactly zero is Mixed. This describes the selected endpoint comparison. It does not independently evaluate the size, steadiness, or trading activity behind that movement.
How Rate of Change is calculated
ROC = 100 × (current close / earlier close − 1). The price-change variant subtracts the earlier close instead. The default lookback is 12 candles. The page is published on Rate of change, period 12. A period counts candles at the interval you choose, so the same setting covers a different stretch of time on a one-hour chart than on a daily one. How smoothing and missing candles are handled.
A calculation you can follow
This invented example shows why the moving comparison point matters as much as the latest close. Suppose the close 12 candles ago was $80,000 and the latest close is $84,000. The dollar difference is $4,000.Rate of Change = 100 × ($84,000 ÷ $80,000 − 1) = +5%. The Price change variant displays the same move as +$4,000.At the next observation, suppose the close is $85,000, but the comparison close rolling into the calculation is $82,000. Rate of Change is now 100 × ($85,000 ÷ $82,000 − 1), approximately +3.66%.The newest close rose by $1,000, while the measured 12-period percentage fell from 5% to 3.66%. The earlier endpoint rose faster than the newer one.A falling Rate of Change can reflect an unusually low comparison price leaving the calculation. Check both endpoint prices before describing a change in the indicator as a fresh change in the market.
Period
The default 12 determines how far back the comparison reaches. A shorter period emphasizes more recent endpoint changes. A longer one includes more elapsed time but still ignores the path between its endpoints. It does not become a moving average when its period increases.
Percentage and dollar variants
Rate of change and Percentage change are equivalent percentage views here. Price change reports latest close minus earlier close in dollars. The percentage version is easier to compare across Bitcoin price levels; the dollar version makes the absolute distance explicit.
Timeframe comparisons
Twelve 1-hour periods and three 4-hour periods cover the same nominal duration, but their closing boundaries must also align for endpoint values to match. Weekly and calendar candles introduce further boundary differences. Report the actual interval and observation time with any cited number.
Equal endpoint gains can hide different journeys
Two periods can both finish 10% higher while one moved smoothly and the other crossed a much wider range. Rate of Change cannot distinguish them. A candle-range measure or the price chart adds information about that missing path.
Gains and losses are not symmetric
A fall from $100,000 to $80,000 is −20%. Returning from $80,000 to $100,000 requires +25%, because the starting price changed. Adding those percentages does not calculate the round-trip result.
Do not turn a short change into an annual promise
A daily or hourly percentage describes an observed span. Multiplying it by the number of such spans in a year assumes a repetition that the calculation does not establish. The page does not make that extrapolation.
Rate of Change compared with MACD
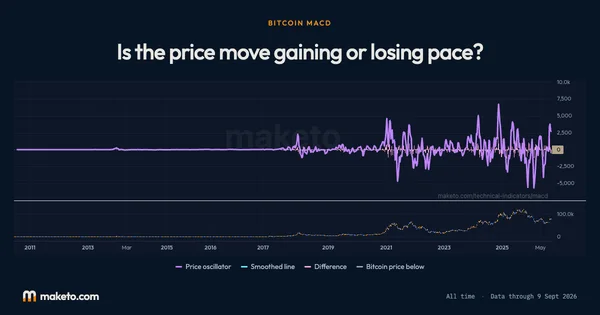
MACD averages many prices before comparing the faster and slower paths. Rate of Change exposes two specific endpoints. Compare them to separate a persistent smoothed move from a reading driven by one unusual earlier or latest close. Open Bitcoin MACD.
Is Rate of Change the same as price speed?
It is a percentage change across a chosen span. Comparing it across different spans without naming those spans is misleading: +5% over 12 hours and +5% over 12 days describe different movement rates.
Does a zero reading mean Bitcoin stayed flat throughout?
No. It means the two endpoint closes are equal. Price may have moved considerably between them.
The numbers
behind the chart
What does the current reading show?
Bitcoin price: the latest reading is $82,946, on . The highest reading since is $122,274 on ; the lowest is $0.0495 on .
Percentage change: the latest reading is 1.53%, on . The highest reading since is 205.51% on ; the lowest is −46.88% on .
Readings since Jul 17, 2010 let you compare Oct 20, 2026 with earlier months. Highest and lowest cover every reading shown; month-end values use the last reading on or before that date. Every figure here is the published daily reading at Rate of change, period 12, beside Bitcoin's own close on the same day. Change the interval or the settings on the chart above and the chart is recalculated in your browser, but this record is not. How Maketo measures the Bitcoin price.
What are the latest, highest and lowest readings?
| Measure | Latest | Highest | Lowest |
|---|---|---|---|
| Bitcoin price | $82,946 | $122,274 | $0.0495 |
| Percentage change | 1.53% | 205.51% | −46.88% |
How do the readings compare with earlier dates?
| Reference date | Bitcoin price | Percentage change |
|---|---|---|
| 1 month ago | $81,235 | 2.71% |
| 3 months ago | $64,989 | 5.70% |
| 6 months ago | $74,815 | 11.73% |
| 1 year ago | $107,197 | −14.03% |
| 2 years ago | $67,617 | 8.90% |
What was the reading at each month’s end?
| Reading date | Bitcoin price | Percentage change |
|---|---|---|
| $84,462 | 11.74% | |
| $77,842 | 23.88% | |
| $63,901 | −0.0094% | |
| $60,164 | −6.66% | |
| $73,771 | −4.13% | |
| $76,327 | 0.8049% | |
| $68,250 | −2.39% | |
| $67,627 | −1.74% | |
| $84,192 | −10.10% | |
| $87,568 | −0.6214% | |
| $88,279 | −13.15% | |
| $111,658 | −3.09% | |
| $109,008 | −5.98% | |
| $111,780 | −5.55% | |
| $119,452 | 1.43% | |
| $107,077 | 1.40% | |
| $107,797 | 4.17% | |
| $94,264 | 10.96% | |
| $82,385 | −0.3958% | |
| $84,330 | −12.26% | |
| $103,740 | −0.3416% | |
| $92,710 | −7.46% | |
| $96,425 | 6.56% | |
| $70,262 | 2.77% |
Keep exploring


Source: Calculated by Maketo on one combined spot market, daily candles. Reading for .