

BITCOIN MACD
Is the price move gaining or losing pace?
Mixed, at $39.22. As of Oct 20, 2026.
Bitcoin MACD
Daily candles
1D candles. Last closed candle: 2026-10-20 00:00:00 UTC.
Drag to zoom, shift and drag to pan. Click the chart before scrolling to zoom with the wheel, and press Escape to let the page scroll again. The candle interval changes the calculation; the range buttons change only the dates on screen.
MACD compares a faster average price with a slower one. The space between them shows whether the recent price path is pulling away from its longer reference. Pick a candle interval and the chart recalculates.
Change the calculation
The last twelve readings as a table
| Candle start, UTC | Price oscillator |
|---|---|
| 2026-08-04 00:00:00 UTC | $-91.222 |
| 2026-08-12 00:00:00 UTC | $-17.705 |
| 2026-08-19 00:00:00 UTC | $374.84 |
| 2026-08-27 00:00:00 UTC | $4,157.1 |
| 2026-09-03 00:00:00 UTC | $3,494.01 |
| 2026-09-11 00:00:00 UTC | $2,021.73 |
| 2026-09-19 00:00:00 UTC | $1,307.99 |
| 2026-09-26 00:00:00 UTC | $2,473.39 |
| 2026-10-04 00:00:00 UTC | $2,016.22 |
| 2026-10-11 00:00:00 UTC | $915.76 |
| 2026-10-19 00:00:00 UTC | $-11.164 |
| 2026-10-20 00:00:00 UTC | $39.216 |
Quote this chart
The image is of the chart as you have it. The link is to the page, which opens on the published reading, so the sentence above is what tells a reader which interval and formula the quotation was taken on.
Maketo. Bitcoin MACD (macd; fast 12, slow 26, signal 9), 1D candles, Maketo combined market. Last closed candle: 2026-10-20 00:00:00 UTC. Calculation version 1.0.0. https://maketo.com/technical-indicators/macd
Source: <a href="https://maketo.com/technical-indicators/macd">Maketo Bitcoin MACD</a>
RIGHT NOW
Mixed, at $39.22. As of Oct 20, 2026.
What the day shows
At the 2026-10-20 UTC close, the reading was 39.2159. The previous available reading was -11.1641. This compares faster and slower price averages to show which way recent price movement is leaning.
How to read that number
A positive histogram means MACD is above its own recent average. MACD can still be below zero, so improving pace is not the same as an established upward trend.
What it was read at
MACD, fast 12, signal 9, slow 26, on daily candles. Change the interval or the settings on the chart above and every number there is recalculated in your browser. This sentence keeps the daily reading the page is published on.
Understanding
Bitcoin MACD
Where it stands today
MACD: mixed, at $39.22 as of .
What is Bitcoin MACD?
Bitcoin MACD compares a faster smoothed price with a slower one. The name means Moving Average Convergence Divergence: whether those two averages are coming together or moving apart. The default line subtracts the 26-period exponential moving average from the 12-period one. Both averages use closes, so the result describes the recent price path rather than trading volume.The chart contains three related measurements. MACD is the gap between the averages. The signal line is a 9-period exponential average of MACD itself. The histogram, the series of vertical bars, is MACD minus that signal line. These are different views of one calculation, so agreement among them is not three independent pieces of evidence.
Start with which side of zero
A positive MACD means the faster price average is above the slower one. A negative value means it is below. Zero means they are equal. This is a comparison between averages; it does not require the latest candle to have moved in the same direction.
Then look at the gap from its smoothed line
MACD above its signal line is above its own recent smoothed level. The histogram is therefore positive. MACD can remain negative while that histogram turns positive: the faster price average is still lower, but the gap is improving relative to its recent pattern. Describing both comparisons avoids calling every positive histogram an established upward price path.
Read shrinking bars carefully
Positive bars getting smaller mean MACD is drawing closer to its signal line. They do not mean Bitcoin’s price has already started falling. Maketo’s default direction reads Rising only when MACD is positive and above its signal, Falling when it is negative and below its signal, and Mixed when those comparisons disagree or touch.
How MACD is calculated
Standard MACD subtracts the 26-candle exponential average from the 12-candle average. Its signal line is a 9-candle exponential average of MACD; the histogram is MACD minus signal. PPO divides the difference by the slow average. The page is published on MACD, fast 12, signal 9, slow 26. A period counts candles at the interval you choose, so the same setting covers a different stretch of time on a one-hour chart than on a daily one. How smoothing and missing candles are handled.
A calculation you can follow
Consider these invented, already initialized averages for one completed Bitcoin candle. Suppose the 12-period average is $102,000 and the 26-period average is $100,000. MACD is $102,000 − $100,000 = $2,000.If the previous 9-period signal value was $1,500, its update weight is 2 ÷ (9 + 1) = 0.2. The new signal is $1,500 + 0.2 × ($2,000 − $1,500) = $1,600.The histogram is $2,000 − $1,600 = $400. Both the gap between price averages and the gap above the signal are positive.The percentage variant divides the price-average gap by the slower average: 100 × $2,000 ÷ $100,000 = 2%. Its signal must be calculated from the percentage series, not copied from the dollar signal.A MACD of $2,000 is an average-price gap, not a $2,000 forecast. Its meaning depends on the slower price level and the selected candle interval.
The 12/26/9 preset
The first two settings control the price averages; the third controls the smoothed MACD line. Shortening the signal period makes it follow MACD more closely. Changing it does not change the MACD line itself. The faster price period must remain shorter than the slower period.
Absolute and percentage variants
The Absolute Price Oscillator view shows the same exponential-average gap in dollars without the signal or histogram; its direction label follows only the gap’s sign. The Percentage Price Oscillator divides the gap by the slower average and multiplies by 100. Its direction still requires agreement between zero and its own signal line. Percentages make different Bitcoin price levels easier to compare.
Initialization and intervals
Each price average starts from its own first full window of closes. The signal starts only after enough MACD values exist. Some implementations initialize the faster average later, producing early-history differences. A 12-hour average and a 12-day average also describe different data, even when the chart settings look identical.
Do not compare dollar heights across eras uncritically
A $500 gap is 5% of a $10,000 slower average but 0.5% of a $100,000 average. The percentage variant separates that price-scale effect from the gap’s relative size.
Repeated crossings can describe little net movement
When closes alternate around a stable level, the faster average and signal can repeatedly change sides. Count the size and persistence of the underlying movement, not just the number of crossings. A still-forming candle can change these relationships before its close.
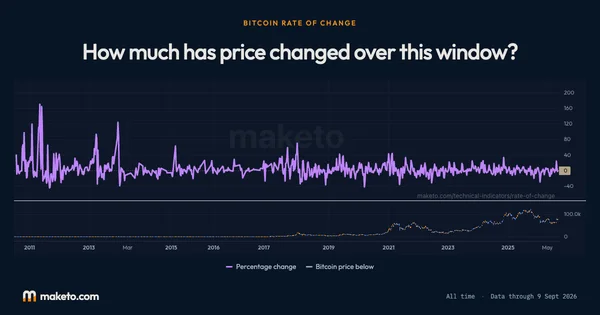
MACD compared with Rate of Change
Rate of Change compares today’s close directly with an earlier close. MACD instead compares two smoothed paths. If Rate of Change jumps while MACD barely moves, inspect whether a single endpoint change caused the difference or whether a longer sequence of closes is moving. Open Bitcoin Rate of Change.
Can MACD rise while Bitcoin falls?
Yes. The averages carry earlier prices, and a negative gap can become less negative as the path changes. The line’s latest direction, its position around zero, and the latest candle’s direction are separate facts.
Does a zero histogram mean the two price averages are equal?
No. It means MACD equals its signal line. The faster and slower price averages are equal only when MACD itself is zero.
The numbers
behind the chart
What does the current reading show?
Bitcoin price: the latest reading is $82,946, on . The highest reading since is $122,419 on ; the lowest is $0.0495 on .
Price oscillator: the latest reading is $39.22, on . The highest reading since is $6,228 on ; the lowest is −$5,707 on .
Smoothed line: the latest reading is $322.21, on . The highest reading since is $6,201 on ; the lowest is −$5,179 on .
Difference: the latest reading is −$283.00, on . The highest reading since is $1,445 on ; the lowest is −$1,516 on .
Readings since Jul 17, 2010 let you compare Oct 20, 2026 with earlier months. Highest and lowest cover every reading shown; month-end values use the last reading on or before that date. Every figure here is the published daily reading at MACD, fast 12, signal 9, slow 26, beside Bitcoin's own close on the same day. Change the interval or the settings on the chart above and the chart is recalculated in your browser, but this record is not. How Maketo measures the Bitcoin price.
What are the latest, highest and lowest readings?
| Measure | Latest | Highest | Lowest |
|---|---|---|---|
| Bitcoin price | $82,946 | $122,419 | $0.0495 |
| Price oscillator | $39.22 | $6,228 | −$5,707 |
| Smoothed line | $322.21 | $6,201 | −$5,179 |
| Difference | −$283.00 | $1,445 | −$1,516 |
How do the readings compare with earlier dates?
| Reference date | Bitcoin price | Price oscillator | Smoothed line | Difference |
|---|---|---|---|---|
| 1 month ago | $81,235 | $1,308 | $1,476 | −$168.32 |
| 3 months ago | $65,216 | $336.54 | $6.35 | $330.19 |
| 6 months ago | $75,853 | $1,673 | $1,297 | $375.64 |
| 1 year ago | $108,663 | −$2,017 | −$689.63 | −$1,327 |
| 2 years ago | $69,023 | $1,773 | $1,180 | $592.19 |
What was the reading at each month’s end?
| Reading date | Bitcoin price | Price oscillator | Smoothed line | Difference |
|---|---|---|---|---|
| $84,433 | $2,473 | $2,163 | $310.03 | |
| $80,266 | $4,157 | $2,845 | $1,312 | |
| $63,698 | $330.13 | $354.22 | −$24.09 | |
| $59,942 | −$2,327 | −$2,300 | −$27.55 | |
| $73,519 | −$759.06 | −$160.93 | −$598.13 | |
| $77,371 | $2,015 | $1,864 | $150.73 | |
| $66,345 | −$568.86 | −$119.44 | −$449.42 | |
| $67,991 | −$3,530 | −$4,102 | $572.54 | |
| $88,299 | −$633.10 | $96.21 | −$729.30 | |
| $87,841 | −$1,217 | −$1,428 | $211.26 | |
| $90,480 | −$5,203 | −$5,179 | −$24.36 | |
| $114,104 | −$898.00 | −$1,394 | $495.82 | |
| $109,657 | −$750.46 | −$47.11 | −$703.35 | |
| $111,258 | −$1,195 | −$496.43 | −$698.25 | |
| $118,066 | $2,176 | $2,556 | −$379.95 | |
| $107,077 | $280.37 | $107.24 | $173.13 | |
| $107,797 | $3,407 | $3,742 | −$334.99 | |
| $95,028 | $2,927 | $1,906 | $1,020 | |
| $84,403 | −$663.24 | −$1,274 | $610.78 | |
| $84,181 | −$2,394 | −$1,331 | −$1,062 | |
| $102,589 | $2,025 | $1,702 | $323.72 | |
| $94,235 | $265.82 | $1,338 | −$1,072 | |
| $95,907 | $5,740 | $6,201 | −$461.47 | |
| $67,982 | $1,356 | $1,414 | −$58.24 |
Keep exploring



Source: Calculated by Maketo on one combined spot market, daily candles. Reading for .