

BITCOIN STOCHASTIC
Where did price close inside its recent range?
Mixed, at 39.03%. As of Oct 20, 2026.
Bitcoin Stochastic
Daily candles
1D candles. Last closed candle: 2026-10-20 00:00:00 UTC.
Drag to zoom, shift and drag to pan. Click the chart before scrolling to zoom with the wheel, and press Escape to let the page scroll again. The candle interval changes the calculation; the range buttons change only the dates on screen.
The stochastic oscillator compares the latest close with the highest and lowest prices in a recent window. It measures position in that window, rather than the speed of the move. Pick a candle interval and the chart recalculates.
Change the calculation
The last twelve readings as a table
| Candle start, UTC | Stochastic |
|---|---|
| 2026-08-02 00:00:00 UTC | 16.307% |
| 2026-08-10 00:00:00 UTC | 68.694% |
| 2026-08-17 00:00:00 UTC | 37.406% |
| 2026-08-25 00:00:00 UTC | 89.762% |
| 2026-09-02 00:00:00 UTC | 75.606% |
| 2026-09-10 00:00:00 UTC | 25.184% |
| 2026-09-18 00:00:00 UTC | 43.656% |
| 2026-09-26 00:00:00 UTC | 75.23% |
| 2026-10-03 00:00:00 UTC | 67.073% |
| 2026-10-11 00:00:00 UTC | 39.506% |
| 2026-10-19 00:00:00 UTC | 28.368% |
| 2026-10-20 00:00:00 UTC | 39.027% |
Quote this chart
The image is of the chart as you have it. The link is to the page, which opens on the published reading, so the sentence above is what tells a reader which interval and formula the quotation was taken on.
Maketo. Bitcoin Stochastic (slow; period 14, smoothK 3, smoothD 3), 1D candles, Maketo combined market. Last closed candle: 2026-10-20 00:00:00 UTC. Calculation version 1.0.0. https://maketo.com/technical-indicators/stochastic
Source: <a href="https://maketo.com/technical-indicators/stochastic">Maketo Bitcoin Stochastic</a>
RIGHT NOW
Mixed, at 39.03%. As of Oct 20, 2026.
What the day shows
At the 2026-10-20 UTC close, the reading was 39.0273. The previous available reading was 28.3679. This places the daily closing price inside its recent high-to-low range. The selected period is 14 daily candles.
How to read that number
Near 100 means closes sit near the top of the recent range. Near zero means they sit near the bottom. Compare %K with %D to see a change in that position.
What it was read at
Slow stochastic, period 14, smooth d 3, smooth k 3, on daily candles. Change the interval or the settings on the chart above and every number there is recalculated in your browser. This sentence keeps the daily reading the page is published on.
Understanding
Bitcoin Stochastic
Where it stands today
Stochastic: mixed, at 39.03% as of .
What is Bitcoin Stochastic?
Bitcoin’s stochastic indicator asks where the latest close sits inside the recent highest-to-lowest price range. It converts that location into a 0–100 scale. A raw value of 80 places the close four-fifths of the way from the lowest low to the highest high. It says nothing by itself about the dollar size of that range.Maketo’s default slow stochastic uses 14 candles for the range and two stages of 3-period simple averaging. The first displayed line, %K, is the smoothed range position. The second, %D, averages that displayed line again. Smoothing makes the reading steadier, but also means the displayed value can differ from the latest candle’s raw position.
Locate the close within the range
The unsmoothed calculation is 100 × (close − lowest low) ÷ (highest high − lowest low). A close at the highest high gives 100; a close at the lowest low gives 0. Near the top does not mean the range must end there: new highs can lift the entire range while the indicator stays high.
Compare the two displayed lines
When %K sits above %D, the quicker smoothed range position is above its slower average. When it sits below, the reverse holds. A crossing below %D near 90 describes a change in range position, while both readings can still be near the top of the range.
Separate chart thresholds from direction
The threshold view defaults to 20 and 80 and records completed-candle crossings of %K. Maketo’s directional summary instead requires %K above 50 and above %D for Rising, or below both for Falling. Conflicting comparisons are Mixed. Moving the chart thresholds changes the recorded events, not that directional rule.
How Stochastic is calculated
Raw %K = 100 × (close − lowest low) / (highest high − lowest low). Slow and full variants smooth %K and add a %D average. Defaults use 14 candles with 3-candle smoothing. The page is published on Slow stochastic, period 14, smooth d 3, smooth k 3. A period counts candles at the interval you choose, so the same setting covers a different stretch of time on a one-hour chart than on a daily one. How smoothing and missing candles are handled.
A calculation you can follow
These invented values illustrate the difference between raw position and the default two-stage smoothing. Suppose the highest high across 14 candles is $110,000, the lowest low is $90,000, and the latest close is $106,000.The raw position is 100 × ($106,000 − $90,000) ÷ ($110,000 − $90,000) = 80.If the previous two raw positions were 50 and 65, the 3-period %K is (50 + 65 + 80) ÷ 3 = 65.If the previous two smoothed %K values were 55 and 60, the new %D is (55 + 60 + 65) ÷ 3 = 60. The displayed %K is above both 50 and its %D, even though it is below the raw 80.The calculation does not disagree with the close. It deliberately averages several range positions, each calculated using that candle’s own rolling high and low.
Fast, slow and full
Fast uses a 14-candle range, no first-stage smoothing beyond one observation, and a 3-period %D. Slow defaults to 14/3/3. Full exposes the same adjustable stages and starts at 14/3/3, so it initially matches Slow. The names describe settings, not separate sources of market evidence.
Longer range windows
A longer period keeps an old high or low in the comparison for longer. When that extreme finally leaves, the range position can move sharply without an equally large change in the latest close. Inspect the range endpoints when a reading jumps.
Smoothing and available candles
The default first %K needs 16 consecutive candles: 14 for the first raw position, then two more for its 3-value average. Its first %D needs 18. Changing the timeframe changes the elapsed time represented by every stage. Missing candles interrupt these windows.
A narrow range can look dramatic
A small dollar move through a narrow high-low range can send the indicator from near 0 to near 100. Read the price chart alongside the scale; an 80-point indicator change is not an 80% Bitcoin price change.
Do not double-count equivalent measurements
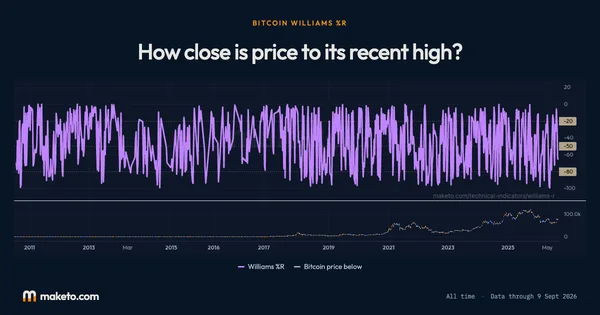
Raw stochastic and Williams %R contain the same range-position information on shifted scales. Their agreement is mathematical, not an independent confirmation. Stochastic RSI is different again: it applies range positioning to RSI values rather than to price highs and lows.
Stochastic compared with Williams %R
Williams %R equals raw stochastic minus 100 when the period and prices match. Compare it with the Fast view’s unsmoothed %K to see the scale translation; comparing it with Slow includes a smoothing difference as well. Open Bitcoin Williams %R.
What happens if the entire range is flat?
When the highest high equals the lowest low, division would be undefined. Maketo assigns the raw position 50, the midpoint, before applying the selected smoothing.
Why is a close near the high paired with a lower indicator reading?
In the Slow and Full views, %K averages several raw positions. Earlier closes lower in their ranges can keep that average below today’s raw position.
The numbers
behind the chart
What does the current reading show?
Bitcoin price: the latest reading is $82,946, on . The highest reading since is $121,679 on ; the lowest is $0.0495 on .
Stochastic: the latest reading is 39.03%, on . The highest reading since is 98.82% on ; the lowest is 4.07% on .
Smoothed line: the latest reading is 31.26%, on . The highest reading since is 98.45% on ; the lowest is 4.08% on .
Readings since Jul 17, 2010 let you compare Oct 20, 2026 with earlier months. Highest and lowest cover every reading shown; month-end values use the last reading on or before that date. Every figure here is the published daily reading at Slow stochastic, period 14, smooth d 3, smooth k 3, beside Bitcoin's own close on the same day. Change the interval or the settings on the chart above and the chart is recalculated in your browser, but this record is not. How Maketo measures the Bitcoin price.
What are the latest, highest and lowest readings?
| Measure | Latest | Highest | Lowest |
|---|---|---|---|
| Bitcoin price | $82,946 | $121,679 | $0.0495 |
| Stochastic | 39.03% | 98.82% | 4.07% |
| Smoothed line | 31.26% | 98.45% | 4.08% |
How do the readings compare with earlier dates?
| Reference date | Bitcoin price | Stochastic | Smoothed line |
|---|---|---|---|
| 1 month ago | $80,879 | 43.66% | 26.59% |
| 3 months ago | $63,907 | 69.04% | 78.00% |
| 6 months ago | $74,164 | 79.50% | 81.66% |
| 1 year ago | $108,197 | 28.42% | 37.77% |
| 2 years ago | $66,077 | 71.08% | 56.55% |
What was the reading at each month’s end?
| Reading date | Bitcoin price | Stochastic | Smoothed line |
|---|---|---|---|
| $84,433 | 75.23% | 77.02% | |
| $78,535 | 89.76% | 89.70% | |
| $64,313 | 52.70% | 65.70% | |
| $60,987 | 34.34% | 40.31% | |
| $73,575 | 19.09% | 14.87% | |
| $76,327 | 44.61% | 54.86% | |
| $66,767 | 11.05% | 10.09% | |
| $67,487 | 47.34% | 33.90% | |
| $88,299 | 13.97% | 16.40% | |
| $87,329 | 38.40% | 35.55% | |
| $87,345 | 26.41% | 22.44% | |
| $111,025 | 38.22% | 29.80% | |
| $112,011 | 35.28% | 52.63% | |
| $108,248 | 9.94% | 16.54% | |
| $117,835 | 51.41% | 51.25% | |
| $108,373 | 87.09% | 84.27% | |
| $105,582 | 55.70% | 66.23% | |
| $93,759 | 88.66% | 91.60% | |
| $87,224 | 81.46% | 84.38% | |
| $91,544 | 34.07% | 46.51% | |
| $102,421 | 50.75% | 49.22% | |
| $93,479 | 10.11% | 11.83% | |
| $96,425 | 72.65% | 68.69% | |
| $72,338 | 89.50% | 85.60% |
Keep exploring


Source: Calculated by Maketo on one combined spot market, daily candles. Reading for .