

BITCOIN WILLIAMS %R
How close is price to its recent high?
Mixed, at −45.02%. As of Oct 20, 2026.
Bitcoin Williams %R
Daily candles
1D candles. Last closed candle: 2026-10-20 00:00:00 UTC.
Drag to zoom, shift and drag to pan. Click the chart before scrolling to zoom with the wheel, and press Escape to let the page scroll again. The candle interval changes the calculation; the range buttons change only the dates on screen.
Williams %R places the latest close between a recent high and low. Its scale runs from zero at the high to −100 at the low. Pick a candle interval and the chart recalculates.
Change the calculation
The last twelve readings as a table
| Candle start, UTC | Williams %R |
|---|---|
| 2026-08-05 00:00:00 UTC | -41.384% |
| 2026-08-13 00:00:00 UTC | -62.341% |
| 2026-08-20 00:00:00 UTC | -3.482% |
| 2026-08-28 00:00:00 UTC | -19.327% |
| 2026-09-04 00:00:00 UTC | -38.806% |
| 2026-09-12 00:00:00 UTC | -80.188% |
| 2026-09-19 00:00:00 UTC | -9.839% |
| 2026-09-27 00:00:00 UTC | -23.502% |
| 2026-10-04 00:00:00 UTC | -13.525% |
| 2026-10-12 00:00:00 UTC | -79.461% |
| 2026-10-19 00:00:00 UTC | -69.437% |
| 2026-10-20 00:00:00 UTC | -45.021% |
Quote this chart
The image is of the chart as you have it. The link is to the page, which opens on the published reading, so the sentence above is what tells a reader which interval and formula the quotation was taken on.
Maketo. Bitcoin Williams %R (williams-r; period 14), 1D candles, Maketo combined market. Last closed candle: 2026-10-20 00:00:00 UTC. Calculation version 1.0.0. https://maketo.com/technical-indicators/williams-r
Source: <a href="https://maketo.com/technical-indicators/williams-r">Maketo Bitcoin Williams %R</a>
RIGHT NOW
Mixed, at −45.02%. As of Oct 20, 2026.
What the day shows
At the 2026-10-20 UTC close, the reading was -45.0215. The previous available reading was -69.4375. This measures how close the daily closing price is to the top of its recent range. The selected period is 14 daily candles.
How to read that number
Readings near zero place the close near the top of its range. Readings near −100 put it near the bottom. This is the same range-position idea as raw stochastic with a shifted scale.
What it was read at
Williams %R, period 14, on daily candles. Change the interval or the settings on the chart above and every number there is recalculated in your browser. This sentence keeps the daily reading the page is published on.
Understanding
Bitcoin Williams %R
Where it stands today
Williams %R: mixed, at −45.02% as of .
What is Bitcoin Williams %R?
Bitcoin Williams %R locates the latest close inside the recent price range, counting downward from the highest high. Its scale runs from −100 at the lowest low to 0 at the highest high. A less negative value therefore places the close nearer the top of the range. The minus sign does not mean Bitcoin itself has fallen by that percentage.The default looks across 14 candles, including the current evaluated candle. It uses the highest high and lowest low anywhere in that window, rather than just the first and last closes. This makes it a measure of position inside a range, distinct from a return that compares two prices over time.
Translate the negative scale
At −20, the close is 20% of the range below its highest high, or 80% of the way up from its lowest low. At −80, it is near the lower end. At −50, it is in the middle. These percentages describe distance within the selected range, not the size of a price gain or loss.
Separate range position from candle direction
A candle can close lower than the previous one and still finish near the highest high of the last 14 candles. Williams %R may then remain near zero. Equally, one higher close after a long decline can leave the reading near −100. The indicator retains the context of the full window.
Read the summary boundary
Maketo labels readings at or above −45 Rising, at or below −55 Falling, and the space between them Mixed. The familiar −20 and −80 levels describe the upper and lower parts of the range. They are not promises that price will change direction when reached.
How Williams %R is calculated
%R = −100 × (highest high − close) / (highest high − lowest low), using 14 candles by default. The page is published on Williams %R, period 14. A period counts candles at the interval you choose, so the same setting covers a different stretch of time on a one-hour chart than on a daily one. How smoothing and missing candles are handled.
A calculation you can follow
These invented Bitcoin prices show how the scale behaves with a fixed range and with a changing high. For 14 candles, suppose the highest high is $105,000 and the lowest low is $95,000. The range is $10,000.With a close of $103,000, Williams %R = −100 × ($105,000 − $103,000) ÷ $10,000 = −20.If the close moves to $104,000 while the range stays unchanged, the result becomes −10. The close moved closer to the top.If that next candle instead reaches a high of $107,000 before closing at $104,000, the updated range is $12,000. The result is −100 × $3,000 ÷ $12,000 = −25.In the last case, the close rose but its position within the enlarged range fell. A lower indicator reading does not always require a lower closing price.
Lookback length
Changing the 14-period setting changes which high and low qualify. A longer window may preserve an old extreme that a shorter window has already dropped. The two readings can differ even when their latest close is identical.
The candle interval
A 14-period weekly reading compares 14 weekly highs and lows; a 14-period hourly reading compares 14 hourly candles. The period counts observations, not an automatic number of days. Compare the same interval before drawing conclusions from different charts.
No additional smoothing
This Williams %R view displays the range position directly. There is no signal-line setting or extra moving average. That makes changes easy to trace to the close or range endpoints, while also leaving short-lived movements fully visible.
Old extremes can leave the window
If a very low candle drops out, the new lowest low can move upward. The close’s relative position then changes even without a new price move. Check whether a reading changed because of today’s candle or because the comparison window rolled forward.
High readings can persist
Repeated new highs can keep closes near the top for a long sequence of candles. Near zero is a description of that pattern, not a countdown to a fall. The equivalent caution applies near −100 during a persistent decline.
Do not count a rescaled copy twice
With matching price inputs and periods, Williams %R equals raw stochastic %K minus 100. Those two lines will agree by construction. They offer different presentation, not two independent measurements of the market.
Williams %R compared with Stochastic
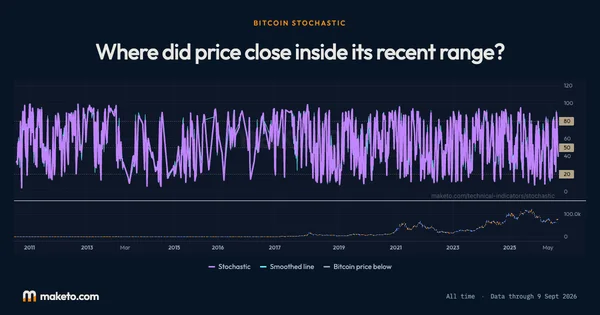
The Fast stochastic view makes the scale relationship clear: raw %K of 80 corresponds to Williams %R of −20. The Slow stochastic view also smooths the raw position, which can make it turn later. Match both the range period and smoothing before comparing readings. Open Bitcoin Stochastic.
Does a reading of −80 mean Bitcoin lost 80%?
No. It means the close is 80% of the selected range below its highest high. The whole range might span only a small percentage of Bitcoin’s price.
What if the highest high and lowest low are equal?
There is no range to divide by. Maketo uses −50, the midpoint, for a completely flat window. Missing candles are treated separately and can leave a reading unavailable.
The numbers
behind the chart
What does the current reading show?
Bitcoin price: the latest reading is $82,946, on . The highest reading since is $122,274 on ; the lowest is $0.0495 on .
Williams %R: the latest reading is −45.02%, on . The highest reading since is 0.0000% on ; the lowest is −98.72% on .
Readings since Jul 17, 2010 let you compare Oct 20, 2026 with earlier months. Highest and lowest cover every reading shown; month-end values use the last reading on or before that date. Every figure here is the published daily reading at Williams %R, period 14, beside Bitcoin's own close on the same day. Change the interval or the settings on the chart above and the chart is recalculated in your browser, but this record is not. How Maketo measures the Bitcoin price.
What are the latest, highest and lowest readings?
| Measure | Latest | Highest | Lowest |
|---|---|---|---|
| Bitcoin price | $82,946 | $122,274 | $0.0495 |
| Williams %R | −45.02% | 0.0000% | −98.72% |
How do the readings compare with earlier dates?
| Reference date | Bitcoin price | Williams %R |
|---|---|---|
| 1 month ago | $81,235 | −9.84% |
| 3 months ago | $64,989 | −1.03% |
| 6 months ago | $74,815 | −12.22% |
| 1 year ago | $107,197 | −83.82% |
| 2 years ago | $67,617 | −8.35% |
What was the reading at each month’s end?
| Reading date | Bitcoin price | Williams %R |
|---|---|---|
| $84,462 | −23.50% | |
| $77,842 | −19.33% | |
| $63,901 | −68.18% | |
| $60,164 | −76.12% | |
| $73,771 | −77.75% | |
| $76,327 | −54.93% | |
| $68,250 | −66.25% | |
| $67,627 | −59.96% | |
| $84,192 | −78.30% | |
| $87,568 | −48.80% | |
| $88,279 | −71.36% | |
| $111,658 | −34.79% | |
| $109,008 | −95.92% | |
| $111,780 | −80.39% | |
| $119,452 | −44.37% | |
| $107,077 | −17.69% | |
| $107,797 | −39.56% | |
| $94,264 | −12.19% | |
| $82,385 | −83.64% | |
| $84,330 | −71.31% | |
| $103,740 | −47.15% | |
| $92,710 | −92.40% | |
| $96,425 | −29.77% | |
| $70,262 | −39.91% |
Keep exploring


Source: Calculated by Maketo on one combined spot market, daily candles. Reading for .