

BITCOIN TRADING VOLUME
How busy is trading compared with this market’s usual pace?
Busier trading, at 27,717. As of Oct 20, 2026.
Bitcoin Trading Volume
Daily candles
1D candles. Last closed candle: 2026-10-20 00:00:00 UTC.
Drag to zoom, shift and drag to pan. Click the chart before scrolling to zoom with the wheel, and press Escape to let the page scroll again. The candle interval changes the calculation; the range buttons change only the dates on screen.
Volume is the amount of Bitcoin traded in the covered spot market during each candle. Relative volume compares a completed candle with a recent average. Pick a candle interval and the chart recalculates.
Change the calculation
The last twelve readings as a table
| Candle start, UTC | Traded Bitcoin |
|---|---|
| 2026-08-05 00:00:00 UTC | 29,025.8 BTC |
| 2026-08-13 00:00:00 UTC | 24,151.62 BTC |
| 2026-08-20 00:00:00 UTC | 74,544.63 BTC |
| 2026-08-28 00:00:00 UTC | 47,611.71 BTC |
| 2026-09-04 00:00:00 UTC | 38,652.48 BTC |
| 2026-09-12 00:00:00 UTC | 12,577.63 BTC |
| 2026-09-19 00:00:00 UTC | 20,945 BTC |
| 2026-09-27 00:00:00 UTC | 17,591.44 BTC |
| 2026-10-04 00:00:00 UTC | 14,627.22 BTC |
| 2026-10-12 00:00:00 UTC | 28,106.23 BTC |
| 2026-10-19 00:00:00 UTC | 25,469.32 BTC |
| 2026-10-20 00:00:00 UTC | 27,716.71 BTC |
Quote this chart
The image is of the chart as you have it. The link is to the page, which opens on the published reading, so the sentence above is what tells a reader which interval and formula the quotation was taken on.
Maketo. Bitcoin Trading Volume (volume; period 20), 1D candles, Maketo combined market. Last closed candle: 2026-10-20 00:00:00 UTC. Calculation version 1.0.0. https://maketo.com/technical-indicators/trading-volume
Source: <a href="https://maketo.com/technical-indicators/trading-volume">Maketo Bitcoin Trading Volume</a>
RIGHT NOW
Busier trading, at 27,717. As of Oct 20, 2026.
What the day shows
At the 2026-10-20 UTC close, the reading was 27,716.7. The previous available reading was 25,469.3. This counts Bitcoin traded across the markets included in the daily price calculation. The selected period is 20 daily candles.
How to read that number
A larger reading means more trading occurred, not that the market necessarily rose. The open candle is incomplete and should not be compared as if its full interval had elapsed.
What it was read at
Volume and average, period 20, on daily candles. Change the interval or the settings on the chart above and every number there is recalculated in your browser. This sentence keeps the daily reading the page is published on.
Understanding
Bitcoin Trading Volume
Where it stands today
Trading Volume: busier trading, at 27,717 as of .
What is Bitcoin Trading Volume?
Trading Volume measures how much Bitcoin traded during each candle in the market covered by this page. Maketo expresses it in BTC. It measures activity, not the direction of that activity: every completed trade has both a buyer and a seller, and the same Bitcoin can change hands repeatedly.The main view shows BTC volume and a 20-candle simple average. Other views answer more specific questions. Relative volume compares the current candle with the preceding average. Volume change compares it with an earlier candle. The seven-period trend compares average activity across two adjacent groups of candles.These comparisons have different denominators, so apparently similar numbers can mean different things. A ratio of 1.5 means one and a half times a reference amount. A change of 50% means an increase of half that reference amount. Neither means that 50% of the Bitcoin supply traded or that buying exceeded selling by 50%.
Start with the unit and elapsed time
A 1-hour candle contains activity during one hour; a daily candle contains a full UTC day when complete. Larger intervals naturally contain more trading. Compare matched intervals and distinguish a forming candle from a completed one before calling activity unusually high or low.
Use relative volume for a preceding baseline
Maketo’s relative views divide current volume by the average of the preceding 20 or 30 candles, excluding the current candle. A value above 1 means busier than that reference, below 1 means quieter, and 1 means equal. Excluding the current candle prevents its own volume from raising the denominator against which it is assessed.
Read direction labels as activity only
Busier trading and Quieter trading describe volume, not price. The main view compares with the preceding candle, relative views compare with 1, and percentage-change views compare with zero. Volume supplies context without an upward or downward price vote.
How Trading Volume is calculated
Base volume is measured in BTC. Relative volume divides the latest completed candle’s volume by the preceding 20-candle average; a 30-period preset is also available. The page is published on Volume and average, period 20. A period counts candles at the interval you choose, so the same setting covers a different stretch of time on a one-hour chart than on a daily one. How smoothing and missing candles are handled.
A calculation you can follow
These illustrative values contrast the main average, relative volume, and percentage change without using a dated market example. Suppose each of the preceding 20 candles traded 100 BTC and the current candle trades 150 BTC. Relative volume is 150 ÷ 100 = 1.5.The main 20-candle average includes the current observation, so it now contains nineteen candles at 100 BTC plus one at 150 BTC. Its value is 102.5 BTC. That is a different baseline from the preceding-only relative calculation.If the immediately preceding candle traded 100 BTC, the one-period volume change is 100 × (150 ÷ 100 − 1) = 50%.For the seven-period trend, suppose the newest seven-candle group averages 120 BTC and the preceding seven averages 100 BTC. The trend is 100 × (120 ÷ 100 − 1) = 20%, regardless of whether the final candle alone rose or fell in volume.The same current volume can be shown as a BTC amount, a ratio to an earlier baseline, or a percentage change. State which comparison you mean when citing the result.
Average and relative periods
The main average includes the current candle; relative volume does not. A 20-candle relative reading needs 21 candles. Longer baselines are less affected by one quiet or busy prior candle, but take longer to reflect a sustained change in activity.
Change and trend lookbacks
Volume change with period 1 compares adjacent candles; a larger period compares with that many candles earlier. The default trend uses two adjacent seven-candle blocks. On a daily interval those are two groups of seven days, not a comparison of the same weekday or a seasonal adjustment.
Zero volume and forming candles
A zero denominator makes a ratio or percentage change unavailable. Missing volume is not replaced with zero. A forming candle contains only the activity recorded so far; the page does not automatically extrapolate it to a full interval.
BTC volume differs from dollar volume
The same BTC amount represents more dollar value when Bitcoin’s price is higher. A chart labelled BTC can therefore look steady while dollar turnover changes. Exact dollar turnover also requires actual trade values, rather than a single candle price multiplied by volume.
More activity does not identify the initiating side
High volume can accompany rises, falls, or little net price change. Determining whether buyers or sellers initiated more of it requires directional trade records. The histogram alone cannot supply that classification.
Trading Volume compared with On-Balance Volume
Trading Volume keeps all recorded activity positive and compares its amount over time. On-Balance Volume assigns the whole candle’s volume a positive or negative sign according to its closing-price change. That creates a directional summary, but still does not classify individual trades. Open Bitcoin On-Balance Volume.
Does relative volume account for weekends or time of day?
No. These views compare with the immediately preceding candles. They do not compare only matching hours, weekdays, or other seasonal groups. Regular changes in activity can therefore affect the ratio.
Can total traded BTC exceed the amount of Bitcoin that exists?
Over a sufficiently long period it can, because the same coins can be traded repeatedly. Volume counts trading activity rather than unique coins or the outstanding supply.
The numbers
behind the chart
What does the current reading show?
Bitcoin price: the latest reading is $82,946, on . The highest reading since is $120,576 on ; the lowest is $0.0495 on .
Traded Bitcoin: the latest reading is 27,717, on . The highest reading since is 920,545 on ; the lowest is 0.0000 on .
Average: the latest reading is 27,797, on . The highest reading since is 435,590 on ; the lowest is 13.63 on .
Readings since Jul 17, 2010 let you compare Oct 20, 2026 with earlier months. Highest and lowest cover every reading shown; month-end values use the last reading on or before that date. Every figure here is the published daily reading at Volume and average, period 20, beside Bitcoin's own close on the same day. Change the interval or the settings on the chart above and the chart is recalculated in your browser, but this record is not. How Maketo measures the Bitcoin price.
What are the latest, highest and lowest readings?
| Measure | Latest | Highest | Lowest |
|---|---|---|---|
| Bitcoin price | $82,946 | $120,576 | $0.0495 |
| Traded Bitcoin | 27,717 | 920,545 | 0.0000 |
| Average | 27,797 | 435,590 | 13.63 |
How do the readings compare with earlier dates?
| Reference date | Bitcoin price | Traded Bitcoin | Average |
|---|---|---|---|
| 1 month ago | $81,235 | 20,945 | 30,055 |
| 3 months ago | $64,989 | 39,683 | 37,089 |
| 6 months ago | $74,815 | 28,915 | 34,236 |
| 1 year ago | $106,447 | 69,272 | 44,687 |
| 2 years ago | $67,067 | 76,896 | 40,146 |
What was the reading at each month’s end?
| Reading date | Bitcoin price | Traded Bitcoin | Average |
|---|---|---|---|
| $84,462 | 17,591 | 32,505 | |
| $77,842 | 47,612 | 36,963 | |
| $63,901 | 33,555 | 28,823 | |
| $60,164 | 42,620 | 34,918 | |
| $73,771 | 18,580 | 27,348 | |
| $76,327 | 24,426 | 30,952 | |
| $68,250 | 44,643 | 38,011 | |
| $67,971 | 16,134 | 62,685 | |
| $84,192 | 68,298 | 33,668 | |
| $87,568 | 24,507 | 26,113 | |
| $88,279 | 52,291 | 54,092 | |
| $111,658 | 11,315 | 46,395 | |
| $109,008 | 39,159 | 22,644 | |
| $111,780 | 34,716 | 29,474 | |
| $119,452 | 18,393 | 33,893 | |
| $107,077 | 24,757 | 27,637 | |
| $107,797 | 29,195 | 37,906 | |
| $95,028 | 40,431 | 43,205 | |
| $82,633 | 21,164 | 41,800 | |
| $84,674 | 75,646 | 42,949 | |
| $101,314 | 41,900 | 57,707 | |
| $93,650 | 22,691 | 54,140 | |
| $97,475 | 50,912 | 87,100 | |
| $72,338 | 51,271 | 44,268 |
Keep exploring
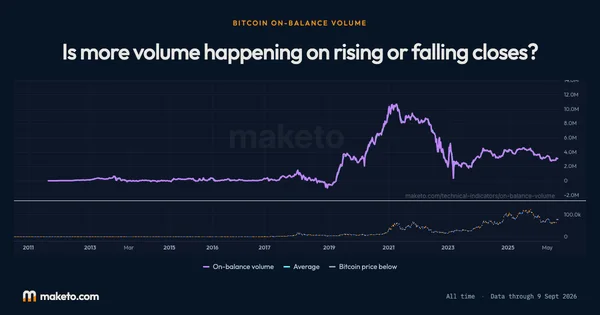


Source: Calculated by Maketo on one combined spot market, daily candles. Reading for .