

BITCOIN ADX AND DIRECTIONAL MOVEMENT
Is the price following a clear direction?
Moderate trend, at 20.05. As of Oct 20, 2026.
Bitcoin ADX and Directional Movement
Daily candles
1D candles. Last closed candle: 2026-10-20 00:00:00 UTC.
Drag to zoom, shift and drag to pan. Click the chart before scrolling to zoom with the wheel, and press Escape to let the page scroll again. The candle interval changes the calculation; the range buttons change only the dates on screen.
ADX measures how strongly prices have been moving in a consistent direction. The two directional lines describe which side has the advantage; ADX itself has no upward or downward sign. Pick a candle interval and the chart recalculates.
Change the calculation
The last twelve readings as a table
| Candle start, UTC | Trend strength |
|---|---|
| 2026-08-02 00:00:00 UTC | 15.162 |
| 2026-08-10 00:00:00 UTC | 10.84 |
| 2026-08-18 00:00:00 UTC | 12.653 |
| 2026-08-26 00:00:00 UTC | 36.028 |
| 2026-09-02 00:00:00 UTC | 43.24 |
| 2026-09-10 00:00:00 UTC | 45.9 |
| 2026-09-18 00:00:00 UTC | 40.853 |
| 2026-09-26 00:00:00 UTC | 43.847 |
| 2026-10-03 00:00:00 UTC | 41.66 |
| 2026-10-11 00:00:00 UTC | 33.782 |
| 2026-10-19 00:00:00 UTC | 21.442 |
| 2026-10-20 00:00:00 UTC | 20.045 |
Quote this chart
The image is of the chart as you have it. The link is to the page, which opens on the published reading, so the sentence above is what tells a reader which interval and formula the quotation was taken on.
Maketo. Bitcoin ADX and Directional Movement (adx; period 14), 1D candles, Maketo combined market. Last closed candle: 2026-10-20 00:00:00 UTC. Calculation version 1.0.0. https://maketo.com/technical-indicators/adx
Source: <a href="https://maketo.com/technical-indicators/adx">Maketo Bitcoin ADX and Directional Movement</a>
RIGHT NOW
Moderate trend, at 20.05. As of Oct 20, 2026.
What the day shows
At the 2026-10-20 UTC close, the reading was 20.0452. The previous available reading was 21.4419. This measures the strength of a price trend. Its value alone does not say whether price is rising or falling. The selected period is 14 daily candles.
How to read that number
Read ADX alongside the directional lines. Rising ADX says the directional pattern is strengthening, whichever way price is moving.
What it was read at
ADX, period 14, on daily candles. Change the interval or the settings on the chart above and every number there is recalculated in your browser. This sentence keeps the daily reading the page is published on.
Understanding
Bitcoin ADX and Directional Movement
Where it stands today
ADX and Directional Movement: moderate trend, at 20.05 as of .
What is Bitcoin ADX and Directional Movement?
Bitcoin ADX measures how clearly recent high-low movements favor one direction over the other. It describes trend strength without choosing upward or downward. A high or rising ADX can accompany a sustained fall as readily as a sustained rise. The accompanying directional lines are needed to tell those situations apart.This family contains three views: ADX for strength, Directional Movement for the upward and downward comparison, and ADX Rating for an additional averaging step. They share a default period of 14. Keeping them together makes their relationship visible without treating each variation as a separate independent indicator.
Build direction from changes in highs and lows
For each candle, upward movement is the increase in its high from the previous high; downward movement is the decrease in its low from the previous low. Only the larger positive move is retained. If neither is positive, or they are equal, neither side receives a directional contribution. These are price measurements, not volumes of upward or downward trades.
Separate the two directional lines from ADX
Wilder smoothing is applied to those movements and true range, the candle’s full range allowing for the previous close. Each smoothed movement is divided by smoothed true range and multiplied by 100 to form +DI and −DI. Their normalized absolute difference forms DX; a further Wilder average of DX forms ADX. Taking an absolute difference removes direction.
Read strength and direction together
Maketo describes ADX below 20 as Weak trend, from 20 to below 25 as Moderate trend, and 25 or higher as Clear trend. ADX and ADX Rating receive no directional vote. The Directional Movement view separately reads Rising when +DI exceeds −DI, Falling when −DI exceeds +DI, and Mixed when equal.
How ADX and Directional Movement is calculated
Directional movement compares successive highs and lows. Wilder smoothing relates positive and negative movement to true range. ADX smooths the percentage gap between the two directional measures over 14 periods. The page is published on ADX, period 14. A period counts candles at the interval you choose, so the same setting covers a different stretch of time on a one-hour chart than on a daily one. How smoothing and missing candles are handled.
A calculation you can follow
This invented example starts after the directional smoothing has been calculated. Suppose the upward directional line is 30 and the downward line is 10. Their absolute difference is 20 and their sum is 40.DX = 100 × |30 − 10| ÷ (30 + 10) = 50.If the previous 14-period ADX was 20, the next update is (13 × 20 + 50) ÷ 14, approximately 22.14. Maketo describes that strength as Moderate trend.If the directional lines were swapped to upward 10 and downward 30, DX and the ADX update would be identical. The Directional Movement label would change from Rising to Falling.The same ADX can describe equally clear movement in opposite directions. Reading ADX alone as an upward or downward price forecast discards the distinction its formula deliberately makes.
The 14-period setting
The period governs the directional smoothing and the later ADX smoothing. Shorter settings generally react sooner to changing candle structure; longer settings retain earlier conditions. Several stages mean ADX needs more data than a single 14-candle average.
ADX Rating
Maketo’s ADXR averages the current ADX with ADX from period minus one candles earlier. With period 14 that means 13 candles earlier. This spacing is a specific calculation convention; some other descriptions use 14. Match the convention before comparing two platforms.
Candle interval and initialization
The default directional lines first need 15 closes with their highs and lows. ADX starts after 28 candles, and ADXR after 41. Switching from daily to weekly candles changes both the movement being measured and the amount of elapsed history needed.
Rising ADX is not rising Bitcoin
ADX can rise as downward movement becomes more consistent. It can fall during an upward price move that has become less one-sided. State the stronger directional line as well as the strength reading when explaining the chart.
A change of direction can temporarily reduce strength
A prior rise followed by a fall can leave both smoothed directional components sizable. Their difference may narrow before the newer direction dominates. ADX can therefore dip during a forceful change in the price path.
The thresholds are descriptions, not probabilities
ADX of 25 does not mean a 25% chance of continuation, and the move from 24.9 to 25 does not suddenly change the market’s nature. Named bands make a continuous measurement easier to read; the underlying value remains continuous.
ADX and Directional Movement compared with Aroon
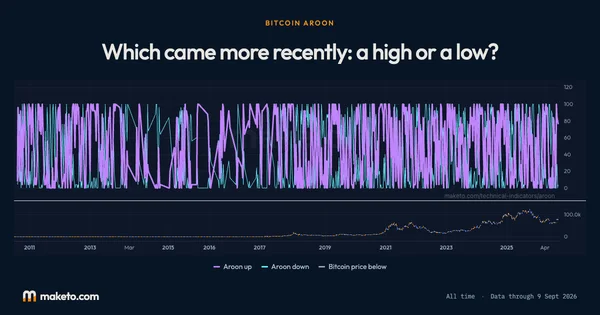
Aroon measures how recently the highest high and lowest low occurred. ADX measures the smoothed imbalance between upward and downward movements. Together they distinguish a recent extreme from a consistently one-sided sequence; either can change while the other remains steady. Open Bitcoin Aroon.
Which line tells me the price direction?
Compare +DI with −DI in the Directional Movement view. ADX itself measures strength and has no upward or downward sign.
Does ADX use closing-price changes like RSI?
No. Its directional ingredients compare consecutive highs and lows, and its range calculation includes the previous close. RSI instead separates consecutive closing changes into gains and losses.
The numbers
behind the chart
What does the current reading show?
Bitcoin price: the latest reading is $82,946, on . The highest reading since is $122,274 on ; the lowest is $0.0495 on .
Trend strength: the latest reading is 20.05, on . The highest reading since is 73.58 on ; the lowest is 7.17 on .
Upward movement: the latest reading is 18.74, on . The highest reading since is 71.20 on ; the lowest is 3.96 on .
Downward movement: the latest reading is 19.46, on . The highest reading since is 54.98 on ; the lowest is 1.17 on .
Readings since Jul 17, 2010 let you compare Oct 20, 2026 with earlier months. Highest and lowest cover every reading shown; month-end values use the last reading on or before that date. Every figure here is the published daily reading at ADX, period 14, beside Bitcoin's own close on the same day. Change the interval or the settings on the chart above and the chart is recalculated in your browser, but this record is not. How Maketo measures the Bitcoin price.
What are the latest, highest and lowest readings?
| Measure | Latest | Highest | Lowest |
|---|---|---|---|
| Bitcoin price | $82,946 | $122,274 | $0.0495 |
| Trend strength | 20.05 | 73.58 | 7.17 |
| Upward movement | 18.74 | 71.20 | 3.96 |
| Downward movement | 19.46 | 54.98 | 1.17 |
How do the readings compare with earlier dates?
| Reference date | Bitcoin price | Trend strength | Upward movement | Downward movement |
|---|---|---|---|---|
| 1 month ago | $80,879 | 40.85 | 36.86 | 12.83 |
| 3 months ago | $64,797 | 23.23 | 15.93 | 25.05 |
| 6 months ago | $74,815 | 16.63 | 25.17 | 16.24 |
| 1 year ago | $108,663 | 32.14 | 16.57 | 34.33 |
| 2 years ago | $68,427 | 18.27 | 31.87 | 15.15 |
What was the reading at each month’s end?
| Reading date | Bitcoin price | Trend strength | Upward movement | Downward movement |
|---|---|---|---|---|
| $84,433 | 43.85 | 34.73 | 14.04 | |
| $79,024 | 36.03 | 44.47 | 8.86 | |
| $64,313 | 18.21 | 16.78 | 23.36 | |
| $60,987 | 34.60 | 15.36 | 33.79 | |
| $76,980 | 19.86 | 14.75 | 20.64 | |
| $78,263 | 21.91 | 27.25 | 12.82 | |
| $68,250 | 16.05 | 19.98 | 24.57 | |
| $66,971 | 51.52 | 13.48 | 30.68 | |
| $89,234 | 23.92 | 19.89 | 24.45 | |
| $87,914 | 19.05 | 16.38 | 17.86 | |
| $90,480 | 46.24 | 13.29 | 28.82 | |
| $114,553 | 23.53 | 27.49 | 22.68 | |
| $109,008 | 18.06 | 13.88 | 25.19 | |
| $110,123 | 16.84 | 16.49 | 24.50 | |
| $117,625 | 28.39 | 21.44 | 16.35 | |
| $106,113 | 17.63 | 16.99 | 23.71 | |
| $107,781 | 32.38 | 25.48 | 14.73 | |
| $93,711 | 17.18 | 29.74 | 10.65 | |
| $82,385 | 23.36 | 14.88 | 23.87 | |
| $84,674 | 40.87 | 6.34 | 35.54 | |
| $102,079 | 13.01 | 15.56 | 24.04 | |
| $94,235 | 26.06 | 18.57 | 27.84 | |
| $91,945 | 51.57 | 27.94 | 15.91 | |
| $67,053 | 19.03 | 24.23 | 19.58 |
Keep exploring


Source: Calculated by Maketo on one combined spot market, daily candles. Reading for .