

BITCOIN AROON
Which came more recently: a high or a low?
Falling, at 28.00. As of Oct 20, 2026.
Bitcoin Aroon
Daily candles
1D candles. Last closed candle: 2026-10-20 00:00:00 UTC.
Drag to zoom, shift and drag to pan. Click the chart before scrolling to zoom with the wheel, and press Escape to let the page scroll again. The candle interval changes the calculation; the range buttons change only the dates on screen.
Aroon measures time since a recent high and low. It can flag a change in the sequence of prices without requiring a large change in their size. Pick a candle interval and the chart recalculates.
Change the calculation
The last twelve readings as a table
| Candle start, UTC | Aroon up |
|---|---|
| 2026-08-06 00:00:00 UTC | 36 |
| 2026-08-14 00:00:00 UTC | 4 |
| 2026-08-21 00:00:00 UTC | 100 |
| 2026-08-29 00:00:00 UTC | 96 |
| 2026-09-05 00:00:00 UTC | 92 |
| 2026-09-12 00:00:00 UTC | 64 |
| 2026-09-20 00:00:00 UTC | 32 |
| 2026-09-27 00:00:00 UTC | 76 |
| 2026-10-04 00:00:00 UTC | 48 |
| 2026-10-12 00:00:00 UTC | 16 |
| 2026-10-19 00:00:00 UTC | 32 |
| 2026-10-20 00:00:00 UTC | 28 |
Quote this chart
The image is of the chart as you have it. The link is to the page, which opens on the published reading, so the sentence above is what tells a reader which interval and formula the quotation was taken on.
Maketo. Bitcoin Aroon (aroon; period 25), 1D candles, Maketo combined market. Last closed candle: 2026-10-20 00:00:00 UTC. Calculation version 1.0.0. https://maketo.com/technical-indicators/aroon
Source: <a href="https://maketo.com/technical-indicators/aroon">Maketo Bitcoin Aroon</a>
RIGHT NOW
Falling, at 28.00. As of Oct 20, 2026.
What the day shows
At the 2026-10-20 UTC close, the reading was 28. The previous available reading was 32. This tracks how recently Bitcoin reached the highest and lowest prices in the selected period. The selected period is 25 daily candles.
How to read that number
Up above Down means the high is more recent than the low. Both lines can be low when older extremes remain unbroken.
What it was read at
Aroon lines, period 25, on daily candles. Change the interval or the settings on the chart above and every number there is recalculated in your browser. This sentence keeps the daily reading the page is published on.
Understanding
Bitcoin Aroon
Where it stands today
Aroon: falling, at 28.00 as of .
What is Bitcoin Aroon?
Bitcoin Aroon measures the age of recent price extremes. Aroon Up tracks how many candles have passed since the highest high; Aroon Down does the same for the lowest low. It focuses on when those extremes occurred rather than how far price moved, making it a useful contrast to indicators based on returns or average-price gaps.The default period is 25. Maketo examines the current candle and the preceding 25, allowing an extreme to be between zero and 25 candles old. Each age becomes a 0–100 reading: a fresh extreme gives 100, while one 25 candles old gives 0. If an extreme is repeated, the most recent equal high or low is used.
A high Up line means a recent high
Aroon Up of 100 means the latest candle contains the window’s highest high, including a tie under Maketo’s most-recent rule. It does not say the price rose 100% or that its latest close is at that high. A candle can reach a high and finish well below it.
Read Down as the age of a low
High Aroon Down means the window’s lowest low occurred recently. A low Down reading means that low is older; it does not, by itself, prove price is rising. Comparing both lines shows which extreme is more recent and how far apart their ages are.
Use the difference without losing the two ages
The oscillator view subtracts Down from Up. Maketo labels a difference of +20 or more Rising, −20 or less Falling, and the space between Mixed. The same difference can come from two high lines or two low lines, so the separate-line view adds context that one difference cannot show.
How Aroon is calculated
Each line converts candles since the window extreme to a 0–100 reading. The oscillator subtracts Aroon Down from Aroon Up. The default window is 25 candles. The page is published on Aroon lines, period 25. A period counts candles at the interval you choose, so the same setting covers a different stretch of time on a one-hour chart than on a daily one. How smoothing and missing candles are handled.
A calculation you can follow
An invented 25-period example demonstrates the age calculation and its fixed steps. Suppose the most recent highest high occurred 5 candles ago and the most recent lowest low occurred 20 candles ago.Aroon Up = 100 × (25 − 5) ÷ 25 = 80. Aroon Down = 100 × (25 − 20) ÷ 25 = 20.The difference is 80 − 20 = +60. The high is considerably more recent than the low.If no new extreme appears on the next candle and both old extremes remain in the window, their ages become 6 and 21. Up becomes 76 and Down becomes 16. Both lines fall by four points, while their difference stays +60.Parallel declines in the two lines can simply mean both extremes are aging. The lower lines are not a measurement of falling Bitcoin prices.
Period and step size
With period 25, each extra candle of age changes a line by four points. With period 20, the step is five points. A smoother-looking range of values from a longer period does not add precision to the underlying high or low; it changes the age scale.
Window and ties
The current candle plus the previous 25 gives 26 observations for the default first reading. Equal highs or lows reset the age to their most recent occurrence. Platforms using another window length or tie rule can disagree even when they show the same nominal period.
Timeframe
A high five daily candles ago is five days old; on a weekly chart it is five weeks old. Candle highs and lows also change with aggregation. Changing from hourly to daily does more than relabel the same line’s time axis.
A tiny new high can reset the clock
A high one dollar above the previous extreme can produce the same Aroon Up value as a high thousands of dollars above it. Aroon describes recency, so compare the price chart or a return measure when magnitude matters.
An extreme can disappear without being exceeded
When an old highest high leaves the window, a lower but more recent high becomes the new reference. Aroon Up can jump even though no new high was set relative to the previous full window. Check the rolling window before attributing every jump to new price strength.
A wide candle can refresh both sides
One candle can reach both the window’s highest high and its lowest low. Both Aroon lines can then be 100 and their difference zero. That describes fresh extremes on both sides, not a quiet market.
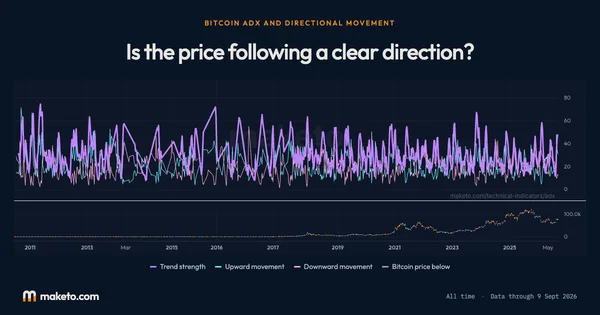
Aroon compared with ADX and Directional Movement
ADX measures smoothed directional imbalance, while Aroon measures the age of extremes. A fresh high can lift Aroon Up without immediately raising ADX. A steady sequence of modest directional moves can raise ADX before a much older extreme is exceeded. Open Bitcoin ADX and Directional Movement.
Why do Aroon lines move in steps?
They count whole candles since an extreme. With the default 25-period setting, one candle corresponds to four points. The step pattern follows directly from that counting rule.
Does a falling Aroon Up line mean price is falling?
No. It means the current window’s highest high is older, unless the rolling window changed its reference. Price can still rise while remaining below that high.
The numbers
behind the chart
What does the current reading show?
Bitcoin price: the latest reading is $82,946, on . The highest reading since is $121,679 on ; the lowest is $0.0495 on .
Aroon up: the latest reading is 28.00, on . The highest reading since is 100.00 on ; the lowest is 0.0000 on .
Aroon down: the latest reading is 80.00, on . The highest reading since is 100.00 on ; the lowest is 0.0000 on .
Readings since Jul 17, 2010 let you compare Oct 20, 2026 with earlier months. Highest and lowest cover every reading shown; month-end values use the last reading on or before that date. Every figure here is the published daily reading at Aroon lines, period 25, beside Bitcoin's own close on the same day. Change the interval or the settings on the chart above and the chart is recalculated in your browser, but this record is not. How Maketo measures the Bitcoin price.
What are the latest, highest and lowest readings?
| Measure | Latest | Highest | Lowest |
|---|---|---|---|
| Bitcoin price | $82,946 | $121,679 | $0.0495 |
| Aroon up | 28.00 | 100.00 | 0.0000 |
| Aroon down | 80.00 | 100.00 | 0.0000 |
How do the readings compare with earlier dates?
| Reference date | Bitcoin price | Aroon up | Aroon down |
|---|---|---|---|
| 1 month ago | $81,164 | 32.00 | 80.00 |
| 3 months ago | $64,717 | 100.00 | 44.00 |
| 6 months ago | $75,718 | 96.00 | 20.00 |
| 1 year ago | $108,197 | 60.00 | 76.00 |
| 2 years ago | $62,860 | 36.00 | 88.00 |
What was the reading at each month’s end?
| Reading date | Bitcoin price | Aroon up | Aroon down |
|---|---|---|---|
| $84,462 | 76.00 | 52.00 | |
| $78,233 | 96.00 | 40.00 | |
| $64,723 | 64.00 | 4.00 | |
| $62,651 | 0.0000 | 28.00 | |
| $77,260 | 24.00 | 92.00 | |
| $77,632 | 88.00 | 8.00 | |
| $66,381 | 60.00 | 0.0000 | |
| $67,487 | 0.0000 | 20.00 | |
| $89,193 | 48.00 | 92.00 | |
| $87,176 | 20.00 | 56.00 | |
| $90,815 | 28.00 | 68.00 | |
| $109,580 | 0.0000 | 44.00 | |
| $113,323 | 76.00 | 8.00 | |
| $111,780 | 52.00 | 100.00 | |
| $119,452 | 48.00 | 0.0000 | |
| $107,325 | 24.00 | 76.00 | |
| $105,582 | 72.00 | 8.00 | |
| $94,177 | 80.00 | 8.00 | |
| $87,505 | 12.00 | 48.00 | |
| $96,263 | 4.00 | 20.00 | |
| $104,861 | 84.00 | 56.00 | |
| $95,735 | 64.00 | 16.00 | |
| $95,907 | 80.00 | 8.00 | |
| $69,943 | 100.00 | 28.00 |
Keep exploring


Source: Calculated by Maketo on one combined spot market, daily candles. Reading for .