

BITCOIN AVERAGE TRUE RANGE
How large are the typical price swings?
Wider swings, at $2,083. As of Oct 20, 2026.
Bitcoin Average True Range
Daily candles
1D candles. Last closed candle: 2026-10-20 00:00:00 UTC.
Drag to zoom, shift and drag to pan. Click the chart before scrolling to zoom with the wheel, and press Escape to let the page scroll again. The candle interval changes the calculation; the range buttons change only the dates on screen.
ATR measures the size of price movement, including the distance from the previous close. It has no direction: a sharp rise and a sharp fall can both increase it. Pick a candle interval and the chart recalculates.
Change the calculation
The last twelve readings as a table
| Candle start, UTC | Price range |
|---|---|
| 2026-08-05 00:00:00 UTC | $1,586.81 |
| 2026-08-13 00:00:00 UTC | $1,355.11 |
| 2026-08-20 00:00:00 UTC | $1,790.97 |
| 2026-08-28 00:00:00 UTC | $2,448.09 |
| 2026-09-04 00:00:00 UTC | $2,524.38 |
| 2026-09-12 00:00:00 UTC | $2,200.96 |
| 2026-09-19 00:00:00 UTC | $2,267.64 |
| 2026-09-27 00:00:00 UTC | $2,256.9 |
| 2026-10-04 00:00:00 UTC | $2,203.79 |
| 2026-10-12 00:00:00 UTC | $2,110.35 |
| 2026-10-19 00:00:00 UTC | $2,070.96 |
| 2026-10-20 00:00:00 UTC | $2,083.18 |
Quote this chart
The image is of the chart as you have it. The link is to the page, which opens on the published reading, so the sentence above is what tells a reader which interval and formula the quotation was taken on.
Maketo. Bitcoin Average True Range (atr; period 14), 1D candles, Maketo combined market. Last closed candle: 2026-10-20 00:00:00 UTC. Calculation version 1.0.0. https://maketo.com/technical-indicators/average-true-range
Source: <a href="https://maketo.com/technical-indicators/average-true-range">Maketo Bitcoin Average True Range</a>
RIGHT NOW
Wider swings, at $2,083. As of Oct 20, 2026.
What the day shows
At the 2026-10-20 UTC close, the reading was 2,083.18. The previous available reading was 2,070.96. This measures the typical size of a daily price move, including gaps from the previous close. The selected period is 14 daily candles.
How to read that number
Higher ATR means larger recent swings in dollars. The percent view compares the scale of movement across different price levels.
What it was read at
Average true range, period 14, on daily candles. Change the interval or the settings on the chart above and every number there is recalculated in your browser. This sentence keeps the daily reading the page is published on.
Understanding
Bitcoin Average True Range
Where it stands today
Average True Range: wider swings, at $2,083 as of .
What is Bitcoin Average True Range?
Average True Range, usually shortened to ATR, measures the size of recent price movements without assigning an upward or downward direction. It starts with each candle’s high and low, then checks whether the distance from the previous close is larger. This extra check captures moves that a candle’s own high-low range would miss.The page offers true range for a single candle, its smoothed average, and that average as a percentage of the latest close. Dollar values describe absolute movement. The percentage view helps compare periods when Bitcoin traded at very different price levels. None of these views counts winning or losing candles.
Why true range can exceed high minus low
True range takes the largest of three distances: high minus low, absolute high minus previous close, and absolute low minus previous close. If the entire new candle sits above the previous close, that earlier price can be farther from the high than the new candle’s low is.
Read rising ATR as wider moves
ATR rises when newer ranges pull its average upward. This can happen during rising or falling prices. It can also happen while the close barely changes if the candle travelled widely before finishing near its starting price. Maketo describes wider or quieter swings, not an upward or downward price call.
Compare matching intervals
A daily candle usually spans more movement than a five-minute candle, so their dollar ATR values answer different questions. The period describes smoothing history, not a future horizon. An ATR of $2,000 does not promise that the next candle will have a $2,000 range.
How Average True Range is calculated
True range is the largest of high − low, |high − previous close| and |low − previous close|. ATR applies Wilder smoothing over 14 candles. ATR percent divides ATR by the close. The page is published on Average true range, period 14. A period counts candles at the interval you choose, so the same setting covers a different stretch of time on a one-hour chart than on a daily one. How smoothing and missing candles are handled.
A calculation you can follow
Use an illustrative previous close of $100,000 followed by a candle with high $107,000, low $102,000 and close $106,000. High minus low is $5,000. The high is $7,000 above the previous close; the low is $2,000 above that close.True range is the largest distance, $7,000. Using only high minus low would miss $2,000 of this measure.If the prior 14-period ATR was $6,000, Wilder’s update gives (13 × $6,000 + $7,000) / 14 = $6,071.43.ATR percent is 100 × $6,071.43 / $106,000, or about 5.73%.A wider new range raised the average slightly. The 5.73% reading describes scale against the latest close. It is neither a probability nor an expected return.
Period
The default is 14 true-range observations. After the starting value, each update weights the new range by 1 / 14 and the old average by 13 / 14. Shorter periods respond more sharply to a large new candle.
Starting value
Maketo seeds ATR with the simple mean of the first full set of true ranges. The first candle has no previous close in its available run, so 14 true ranges need 15 consecutive candles. Other starting conventions can affect early comparisons.
Percentage denominator
ATR percent divides current dollar ATR by the current close. If price falls while dollar ATR stays unchanged, the percentage increases because the same dollar movement is larger against the lower price.
Movement size does not reveal direction
Two paths can have similar candle ranges while one ends higher and the other lower. Direction needs a separate price-based measure. Calling a rising ATR a Rising price signal would combine two different questions.
Missing is different from quiet
A zero range is a real observation of no measured movement. Missing data is an absence of evidence. Known gaps interrupt the calculation and require a new complete run rather than entering as zero.
Average True Range compared with Bollinger Bands
ATR uses highs, lows and the previous close. Bollinger Bands use the spread of closes around their average. Long candle wicks with similar closes can produce a high ATR while band width remains comparatively narrow. Open Bitcoin Bollinger Bands.
Can true range be negative?
No. It measures distances and is nonnegative. It can be zero when high, low and the previous close are identical.
Why is ATR different from a simple average of ranges?
After its initial seed, Wilder’s update lets older observations fade gradually. They do not disappear all at once after fourteen candles, as they would in a simple rolling mean.
Does choosing yearly candles provide enough history?
Only if enough consecutive yearly candles exist. Fourteen true ranges still need fifteen candles. Selecting a longer interval does not create observations, and an incomplete historical year interrupts the usable run.
The numbers
behind the chart
What does the current reading show?
Bitcoin price: the latest reading is $82,946, on . The highest reading since is $122,274 on ; the lowest is $0.0495 on .
Price range: the latest reading is $2,083, on . The highest reading since is $5,270 on ; the lowest is $0.0036 on .
Readings since Jul 17, 2010 let you compare Oct 20, 2026 with earlier months. Highest and lowest cover every reading shown; month-end values use the last reading on or before that date. Every figure here is the published daily reading at Average true range, period 14, beside Bitcoin's own close on the same day. Change the interval or the settings on the chart above and the chart is recalculated in your browser, but this record is not. How Maketo measures the Bitcoin price.
What are the latest, highest and lowest readings?
| Measure | Latest | Highest | Lowest |
|---|---|---|---|
| Bitcoin price | $82,946 | $122,274 | $0.0495 |
| Price range | $2,083 | $5,270 | $0.0036 |
How do the readings compare with earlier dates?
| Reference date | Bitcoin price | Price range |
|---|---|---|
| 1 month ago | $81,235 | $2,268 |
| 3 months ago | $64,989 | $2,056 |
| 6 months ago | $74,815 | $2,527 |
| 1 year ago | $107,197 | $4,024 |
| 2 years ago | $67,617 | $2,156 |
What was the reading at each month’s end?
| Reading date | Bitcoin price | Price range |
|---|---|---|
| $84,462 | $2,257 | |
| $77,842 | $2,448 | |
| $63,901 | $1,659 | |
| $60,164 | $2,216 | |
| $73,771 | $1,900 | |
| $76,327 | $2,269 | |
| $68,250 | $2,740 | |
| $67,627 | $3,096 | |
| $84,192 | $2,704 | |
| $87,568 | $2,717 | |
| $88,279 | $4,299 | |
| $111,658 | $3,739 | |
| $109,008 | $2,473 | |
| $111,780 | $3,287 | |
| $119,452 | $2,794 | |
| $107,077 | $2,918 | |
| $107,797 | $2,970 | |
| $94,264 | $2,933 | |
| $82,385 | $3,316 | |
| $84,330 | $3,972 | |
| $103,740 | $4,210 | |
| $92,710 | $3,889 | |
| $96,425 | $3,436 | |
| $70,262 | $2,162 |
Keep exploring
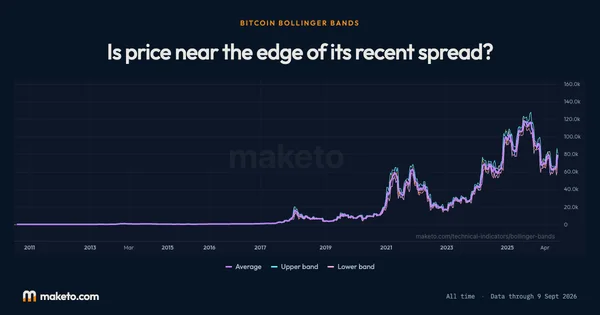


Source: Calculated by Maketo on one combined spot market, daily candles. Reading for .