

BITCOIN ELDER RAY
Are highs and lows pulling away from the average?
Falling, at $888.64. As of Oct 20, 2026.
Bitcoin Elder Ray
Daily candles
1D candles. Last closed candle: 2026-10-20 00:00:00 UTC.
Drag to zoom, shift and drag to pan. Click the chart before scrolling to zoom with the wheel, and press Escape to let the page scroll again. The candle interval changes the calculation; the range buttons change only the dates on screen.
Elder Ray measures the space between the candle extremes and a smooth price reference. Its two lines describe upward and downward reach around that reference. Pick a candle interval and the chart recalculates.
Change the calculation
The last twelve readings as a table
| Candle start, UTC | High above average |
|---|---|
| 2026-08-05 00:00:00 UTC | $1,012.86 |
| 2026-08-13 00:00:00 UTC | $-25.927 |
| 2026-08-20 00:00:00 UTC | $7,559.54 |
| 2026-08-28 00:00:00 UTC | $6,592.01 |
| 2026-09-04 00:00:00 UTC | $3,940.8 |
| 2026-09-12 00:00:00 UTC | $-356.85 |
| 2026-09-19 00:00:00 UTC | $3,741.33 |
| 2026-09-27 00:00:00 UTC | $2,505.18 |
| 2026-10-04 00:00:00 UTC | $2,758.7 |
| 2026-10-12 00:00:00 UTC | $908.46 |
| 2026-10-19 00:00:00 UTC | $726.13 |
| 2026-10-20 00:00:00 UTC | $888.64 |
Quote this chart
The image is of the chart as you have it. The link is to the page, which opens on the published reading, so the sentence above is what tells a reader which interval and formula the quotation was taken on.
Maketo. Bitcoin Elder Ray (elder-ray; period 13), 1D candles, Maketo combined market. Last closed candle: 2026-10-20 00:00:00 UTC. Calculation version 1.0.0. https://maketo.com/technical-indicators/elder-ray
Source: <a href="https://maketo.com/technical-indicators/elder-ray">Maketo Bitcoin Elder Ray</a>
RIGHT NOW
Falling, at $888.64. As of Oct 20, 2026.
What the day shows
At the 2026-10-20 UTC close, the reading was 888.642. The previous available reading was 726.129. This compares each day’s high and low with a smoothed closing-price average. The selected period is 13 daily candles.
How to read that number
Both measures above zero mean the entire candle traded above the average. A lower line moving toward zero can show a narrowing downward reach.
What it was read at
Elder Ray, period 13, on daily candles. Change the interval or the settings on the chart above and every number there is recalculated in your browser. This sentence keeps the daily reading the page is published on.
Understanding
Bitcoin Elder Ray
Where it stands today
Elder Ray: falling, at $888.64 as of .
What is Bitcoin Elder Ray?
Bitcoin Elder Ray compares the high and low of each candle with a smoothed closing-price reference. The default reference is a 13-period exponential moving average. One line shows high minus that average; the other shows low minus that average. Together they describe where the candle’s full range sits relative to the recent price path.This makes Elder Ray different from a single close-versus-average comparison. A candle can close above its average while much of its range lies below, or reach above the average briefly and finish beneath it. Reading the two distances preserves that geometry without claiming to measure individual buyers, sellers or orders.
Read the high’s distance
A positive upper line means the candle’s high exceeded the 13-period average. If it is negative, even the candle’s highest price remained below the average. A bigger positive value means a larger dollar reach above that reference, not a measured amount of buying.
Read the low’s distance
A negative lower line means the candle’s low fell below the average. A positive lower line means the entire candle range remained above it, since the high cannot be below the low. When the upper line is positive and the lower negative, the range straddles the average.
Understand the combined direction label
Maketo adds the two distances. A positive sum is Rising, a negative sum Falling, and zero Mixed. Algebraically, this is twice the candle midpoint’s distance from the exponential average. The summary therefore compares the range midpoint with the smoothed close, while the chart preserves both individual distances.
How Elder Ray is calculated
The upper measure is high minus a 13-candle exponential average of closes. The lower measure is low minus that same average. The page is published on Elder Ray, period 13. A period counts candles at the interval you choose, so the same setting covers a different stretch of time on a one-hour chart than on a daily one. How smoothing and missing candles are handled.
A calculation you can follow
Use these invented prices and an already initialized 13-period average. Suppose the candle’s high is $104,000, its low is $99,000, and the exponential average is $100,000.The upper line is $104,000 − $100,000 = +$4,000. The lower line is $99,000 − $100,000 = −$1,000.Their sum is +$3,000. The candle midpoint is ($104,000 + $99,000) ÷ 2 = $101,500, which is $1,500 above the average; doubling that gives the same +$3,000.If a different candle has a $100,500 high and a $97,000 low against the same $100,000 reference, its distances are +$500 and −$3,000. The sum is −$2,500, even though its high still briefly reached above the average.A positive upper line alone cannot establish the page’s combined direction. The lower part of the candle can extend further below the reference than the high extends above it.
EMA period 13
The default exponential average gives the newest close a weight of 2 ÷ (13 + 1), or one-seventh. A shorter period moves the reference more quickly toward recent closes. A longer period retains more of the earlier closing-price path.
Current reference, current range
Both distances use the moving average calculated at the same candle, including that candle’s close. They do not compare today’s high and low with yesterday’s unchanged average. This detail matters when manually reproducing a large candle’s result.
Candle interval and dollar units
The high and low belong to the selected candle interval, and the period counts candles. A daily range can be much wider than an hourly one. Both lines remain dollar distances, so numerical heights across different intervals and Bitcoin price levels need that context.
A wick does not reveal time or trading quantity
The high and low record extremes, not how long price stayed there or how many Bitcoin traded there. A brief isolated reach can produce a large line value. Volume and actual trade-side evidence are separate measurements.
The reference can move while the range stays similar
Even with similar highs and lows, an evolving exponential average changes both distances. When explaining a move in Elder Ray, check whether the candle moved, the reference moved, or both.
Do not interpret the names as trader identities
Traditional presentations often attach opposing-force names to these lines. Their inputs remain high, low and a moving average. They do not identify which traders initiated transactions or whether a particular group was adding to its holdings.
Elder Ray compared with Exponential Moving Average
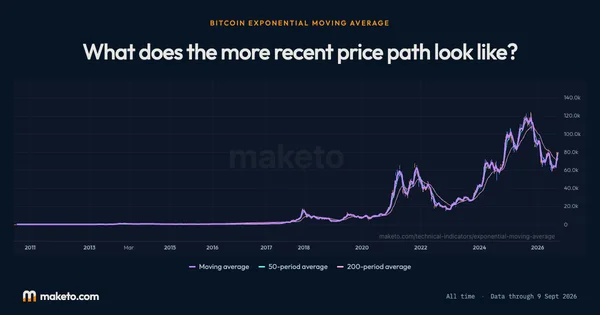
The EMA page shows the closing-price reference directly. Elder Ray shows how far each candle reached above and below it. Use the same period, 13 by default here, to separate movement in the underlying average from changes in the candle’s range. Open Bitcoin Exponential Moving Average.
Can both Elder Ray lines be positive?
Yes. If the low is above the exponential average, the high must be above it too. The whole candle range then lies above the reference. Both can likewise be negative when the whole range is below.
Can the upper line be below the lower line?
Not with valid candle prices and the same average. Their difference is high minus low, which cannot be negative. They are equal only when the candle’s high and low are equal.
The numbers
behind the chart
What does the current reading show?
Bitcoin price: the latest reading is $82,946, on . The highest reading since is $122,274 on ; the lowest is $0.0495 on .
High above average: the latest reading is $888.64, on . The highest reading since is $9,946 on ; the lowest is −$6,872 on .
Low above average: the latest reading is −$1,353, on . The highest reading since is $5,821 on ; the lowest is −$14,456 on .
Readings since Jul 17, 2010 let you compare Oct 20, 2026 with earlier months. Highest and lowest cover every reading shown; month-end values use the last reading on or before that date. Every figure here is the published daily reading at Elder Ray, period 13, beside Bitcoin's own close on the same day. Change the interval or the settings on the chart above and the chart is recalculated in your browser, but this record is not. How Maketo measures the Bitcoin price.
What are the latest, highest and lowest readings?
| Measure | Latest | Highest | Lowest |
|---|---|---|---|
| Bitcoin price | $82,946 | $122,274 | $0.0495 |
| High above average | $888.64 | $9,946 | −$6,872 |
| Low above average | −$1,353 | $5,821 | −$14,456 |
How do the readings compare with earlier dates?
| Reference date | Bitcoin price | High above average | Low above average |
|---|---|---|---|
| 1 month ago | $81,235 | $3,741 | $2,640 |
| 3 months ago | $64,989 | $1,899 | −$960.90 |
| 6 months ago | $74,815 | $3,497 | $1,580 |
| 1 year ago | $107,197 | −$5,037 | −$6,210 |
| 2 years ago | $67,617 | $4,405 | $2,741 |
What was the reading at each month’s end?
| Reading date | Bitcoin price | High above average | Low above average |
|---|---|---|---|
| $84,462 | $2,505 | $1,469 | |
| $77,842 | $6,592 | $1,990 | |
| $63,901 | $303.94 | −$1,153 | |
| $60,164 | −$919.81 | −$2,804 | |
| $73,771 | −$1,648 | −$2,546 | |
| $76,327 | $336.20 | −$1,012 | |
| $68,250 | $114.01 | −$2,477 | |
| $67,627 | −$529.50 | −$1,599 | |
| $84,192 | −$3,774 | −$7,416 | |
| $87,568 | $1,253 | −$734.12 | |
| $88,279 | −$2,364 | −$6,342 | |
| $111,658 | $1,091 | −$173.09 | |
| $109,008 | $38.10 | −$4,862 | |
| $111,780 | −$2,046 | −$5,757 | |
| $119,452 | $2,014 | $59.65 | |
| $107,077 | $2,133 | $731.47 | |
| $107,797 | $2,079 | −$421.84 | |
| $94,264 | $4,049 | $2,329 | |
| $82,385 | −$1,267 | −$3,231 | |
| $84,330 | −$5,982 | −$12,873 | |
| $103,740 | $2,387 | −$1,094 | |
| $92,710 | −$1,263 | −$4,807 | |
| $96,425 | $3,269 | $1,885 | |
| $70,262 | $3,757 | $704.98 |
Keep exploring



Source: Calculated by Maketo on one combined spot market, daily candles. Reading for .