

BITCOIN EXPONENTIAL MOVING AVERAGE
What does the more recent price path look like?
Mixed, at $82,540. As of Oct 20, 2026.
Bitcoin Exponential Moving Average
Daily candles
1D candles. Last closed candle: 2026-10-20 00:00:00 UTC.
Drag to zoom, shift and drag to pan. Click the chart before scrolling to zoom with the wheel, and press Escape to let the page scroll again. The candle interval changes the calculation; the range buttons change only the dates on screen.
An exponential moving average gives more weight to recent prices. Double, triple and T3 variants combine smoothed lines to change responsiveness and smoothness. Pick a candle interval and the chart recalculates.
Change the calculation
The last twelve readings as a table
| Candle start, UTC | Moving average |
|---|---|
| 2026-08-04 00:00:00 UTC | $63,928.63 |
| 2026-08-11 00:00:00 UTC | $64,149.31 |
| 2026-08-19 00:00:00 UTC | $64,407.75 |
| 2026-08-27 00:00:00 UTC | $72,022.65 |
| 2026-09-03 00:00:00 UTC | $75,263.02 |
| 2026-09-11 00:00:00 UTC | $77,004.14 |
| 2026-09-19 00:00:00 UTC | $77,610.01 |
| 2026-09-26 00:00:00 UTC | $81,077.29 |
| 2026-10-04 00:00:00 UTC | $83,035.68 |
| 2026-10-11 00:00:00 UTC | $83,258.22 |
| 2026-10-19 00:00:00 UTC | $82,497.15 |
| 2026-10-20 00:00:00 UTC | $82,539.9 |
Quote this chart
The image is of the chart as you have it. The link is to the page, which opens on the published reading, so the sentence above is what tells a reader which interval and formula the quotation was taken on.
Maketo. Bitcoin Exponential Moving Average (ema; period 20, medium 50, long 200), 1D candles, Maketo combined market. Last closed candle: 2026-10-20 00:00:00 UTC. Calculation version 1.0.0. https://maketo.com/technical-indicators/exponential-moving-average
Source: <a href="https://maketo.com/technical-indicators/exponential-moving-average">Maketo Bitcoin Exponential Moving Average</a>
RIGHT NOW
Mixed, at $82,540. As of Oct 20, 2026.
What the day shows
At the 2026-10-20 UTC close, the reading was 82,539.9. The previous available reading was 82,497.1. Recent daily closes carry more weight in this price average. The selected period is 20 daily candles.
How to read that number
A shorter period responds more quickly. Comparing 20, 50 and 200 periods shows the order and spacing of short and longer paths.
What it was read at
Exponential moving average, long 200, medium 50, period 20, on daily candles. Change the interval or the settings on the chart above and every number there is recalculated in your browser. This sentence keeps the daily reading the page is published on.
Understanding
Bitcoin Exponential Moving Average
Where it stands today
Exponential Moving Average: mixed, at $82,540 as of .
What is Bitcoin Exponential Moving Average?
A Bitcoin exponential moving average, or EMA, gives more weight to recent closes while retaining a fading contribution from older ones. Instead of dropping the oldest close at a fixed boundary, it updates the previous average toward the newest close. The line can therefore respond differently from a simple average using the same period number.The default view displays 20-, 50- and 200-period EMAs. This family also includes DEMA, TEMA and Tillson T3, which combine several exponential smoothing stages. Their names describe related constructions, but they are not interchangeable: some combinations subtract smoothed components to change lag, rather than merely averaging the price repeatedly.
Understand the update weight
For period n, the EMA weight is 2 ÷ (n + 1). The update is previous EMA + weight × (new close − previous EMA). A close above the previous average pulls it upward; a close below pulls it downward. Earlier observations continue to matter through the previous average, with influence fading at each update.
Read price position and line direction together
Maketo’s default summary uses the primary 20-period EMA. Rising requires the close above that EMA and the EMA above its value five candles earlier. Falling requires both comparisons below. When they disagree or touch, the label is Mixed. The same price-and-five-candle comparison applies to the selected alternative line.
Recognize that faster response has a tradeoff
A line that follows a sudden move more closely also gives short-lived changes more influence. A smoother line suppresses some detail but can respond later. No construction removes that tradeoff, and a smaller gap from current price is not proof that an average describes the next move better.
How Exponential Moving Average is calculated
EMA updates by adding α × (new close − prior EMA), with α = 2 / (period + 1). DEMA and TEMA combine repeated EMA stages; T3 uses a configurable volume factor. The page is published on Exponential moving average, long 200, medium 50, period 20. A period counts candles at the interval you choose, so the same setting covers a different stretch of time on a one-hour chart than on a daily one. How smoothing and missing candles are handled.
A calculation you can follow
An invented 9-period update makes the exponential weight easy to calculate. For period 9, the weight is 2 ÷ (9 + 1) = 0.2. Suppose the initialized prior EMA is $100,000 and the new close is $105,000.The new EMA is $100,000 + 0.2 × ($105,000 − $100,000) = $101,000.If the next close remains $105,000, the EMA moves to $101,000 + 0.2 × $4,000 = $101,800. It continues approaching the unchanged price because earlier lower observations still matter.For a separate DEMA illustration, suppose the first EMA stage is $101,000 and the second stage is $100,500. DEMA = 2 × $101,000 − $100,500 = $101,500. It is not simply the second EMA stage.Repeated smoothing and a combination that subtracts smoothing are different operations. The selected variant determines which one the chart displays.
EMA and initialization
Maketo seeds each EMA with the mean of its first full period of inputs. It does not seed it from the very first close. For the default 20-period EMA, the newest input weight is 2/21, about 9.52%. A 20-period EMA still retains older influence beyond 20 candles.
DEMA and TEMA
Let E1 be the EMA of closes, E2 the EMA of E1, and E3 the EMA of E2, all using the same period. DEMA = 2 × E1 − E2. TEMA = 3 × E1 − 3 × E2 + E3. The subtraction changes lag and can create overshoot; these are not ordinary averages confined between their component lines.
Tillson T3 and factor 0.7
T3 uses six successive EMA stages, E1 through E6. With factor f, it combines (1 + f)³ × E3 − 3f(1 + f)² × E4 + 3f²(1 + f) × E5 − f³ × E6. The default factor is 0.7. Despite an older name sometimes used for this factor, no trading volume enters this calculation.
History required by each variant
At period 20, the first EMA needs 20 candles, DEMA 39, TEMA 58, and T3 115 because each stage receives only valid preceding-stage values. A long-period annual version may have insufficient history. Missing candles reset the sequence rather than being filled with repeated prices.
Matching the period does not match the method
EMA 20 and SMA 20 use different weights. DEMA 20 and TEMA 20 also differ from EMA 20 despite sharing the same period. Compare both the method and candle interval when citing or checking a reading.
Combined lines can overshoot
Subtracting slower components can place DEMA, TEMA or T3 beyond recent prices or component averages. Such a value is not automatically a data error. It reflects the chosen smoothing combination, whose behavior should be understood before comparing it with a plain average.
A different starting point can change the result
Exponential calculations retain earlier information. Maketo uses the complete available history before limiting the visible range, so zooming does not reseed the line. Differences between platforms can come from their initial average or from gaps and corrections in their inputs.
Exponential Moving Average compared with Simple Moving Average
Compare a matching-period SMA to see how the weighting changes the line. An SMA moves according to the entering close versus the departing close. An EMA moves according to the new close versus its prior average. Those different update rules explain many apparent disagreements. Open Bitcoin Simple Moving Average.
Is an EMA’s period a strict limit on its memory?
No. The period sets its update weight and initial window. After initialization, earlier inputs remain inside the previous average and their influence fades rather than stopping at a fixed age.
Does T3’s factor weight the candles by trading volume?
No. It controls the coefficients combining successive exponential averages of closes. Actual candle volume is not an input to this family.
The numbers
behind the chart
What does the current reading show?
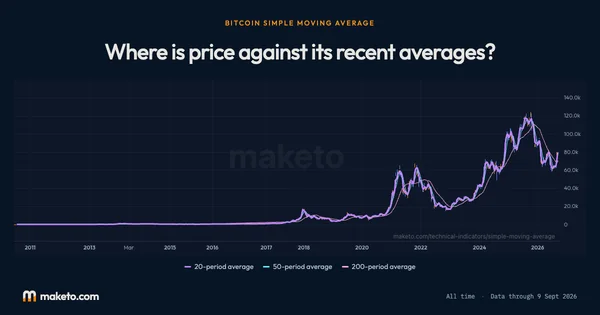
Bitcoin price: the latest reading is $82,946, on . The highest reading since is $122,274 on ; the lowest is $0.0495 on .
Moving average: the latest reading is $82,540, on . The highest reading since is $117,297 on ; the lowest is $0.0619 on .
50-period average: the latest reading is $80,630, on . The highest reading since is $115,701 on ; the lowest is $0.0626 on .
200-period average: the latest reading is $76,002, on . The highest reading since is $108,381 on ; the lowest is $0.1788 on .
Readings since Jul 17, 2010 let you compare Oct 20, 2026 with earlier months. Highest and lowest cover every reading shown; month-end values use the last reading on or before that date. Every figure here is the published daily reading at Exponential moving average, long 200, medium 50, period 20, beside Bitcoin's own close on the same day. Change the interval or the settings on the chart above and the chart is recalculated in your browser, but this record is not. How Maketo measures the Bitcoin price.
What are the latest, highest and lowest readings?
| Measure | Latest | Highest | Lowest |
|---|---|---|---|
| Bitcoin price | $82,946 | $122,274 | $0.0495 |
| Moving average | $82,540 | $117,297 | $0.0619 |
| 50-period average | $80,630 | $115,701 | $0.0626 |
| 200-period average | $76,002 | $108,381 | $0.1788 |
How do the readings compare with earlier dates?
| Reference date | Bitcoin price | Moving average | 50-period average | 200-period average |
|---|---|---|---|---|
| 1 month ago | $81,235 | $77,610 | $74,242 | $73,282 |
| 3 months ago | $65,216 | $63,750 | $64,991 | $74,020 |
| 6 months ago | $73,815 | $72,564 | $71,781 | $82,840 |
| 1 year ago | $108,663 | $113,240 | $114,224 | $108,057 |
| 2 years ago | $68,427 | $64,226 | $62,627 | $60,453 |
What was the reading at each month’s end?
| Reading date | Bitcoin price | Moving average | 50-period average | 200-period average |
|---|---|---|---|---|
| $84,433 | $81,077 | $76,743 | $74,038 | |
| $80,266 | $72,023 | $68,214 | $71,995 | |
| $63,698 | $64,313 | $64,982 | $73,410 | |
| $59,942 | $63,422 | $67,510 | $76,860 | |
| $74,337 | $77,316 | $76,633 | $81,362 | |
| $77,371 | $75,328 | $73,352 | $82,428 | |
| $66,381 | $69,834 | $71,810 | $85,867 | |
| $67,991 | $69,363 | $76,471 | $91,541 | |
| $88,299 | $90,567 | $91,463 | $98,626 | |
| $87,329 | $88,606 | $92,652 | $101,410 | |
| $90,480 | $93,656 | $101,298 | $105,659 | |
| $114,553 | $112,050 | $113,357 | $108,228 | |
| $109,670 | $113,264 | $113,508 | $106,176 | |
| $111,780 | $115,097 | $114,597 | $103,765 | |
| $119,452 | $116,608 | $112,082 | $99,507 | |
| $106,983 | $105,379 | $103,544 | $94,070 | |
| $108,958 | $105,283 | $99,072 | $90,062 | |
| $94,647 | $88,073 | $86,989 | $85,482 | |
| $87,224 | $85,958 | $88,828 | $85,565 | |
| $91,544 | $96,759 | $97,449 | $85,633 | |
| $104,739 | $101,107 | $97,657 | $81,342 | |
| $95,735 | $98,200 | $93,103 | $75,259 | |
| $93,006 | $88,984 | $79,300 | $66,781 | |
| $67,053 | $66,011 | $63,971 | $61,000 |
Keep exploring



Source: Calculated by Maketo on one combined spot market, daily candles. Reading for .