

BITCOIN ICHIMOKU CLOUD
Where is price against its recent trading zones?
Mixed, at $74,943. As of Oct 20, 2026.
Bitcoin Ichimoku Cloud
Daily candles
1D candles. Last closed candle: 2026-10-20 00:00:00 UTC.
Drag to zoom, shift and drag to pan. Click the chart before scrolling to zoom with the wheel, and press Escape to let the page scroll again. The candle interval changes the calculation; the range buttons change only the dates on screen.
Ichimoku combines the midpoints of several recent high-low ranges. The cloud shows a broader comparison zone, while the faster lines show the nearer price structure. Pick a candle interval and the chart recalculates.
Change the calculation
The last twelve readings as a table
| Candle start, UTC | Shorter average |
|---|---|
| 2026-07-30 00:00:00 UTC | $64,691.48 |
| 2026-08-07 00:00:00 UTC | $63,793.31 |
| 2026-08-15 00:00:00 UTC | $63,958 |
| 2026-08-23 00:00:00 UTC | $71,080 |
| 2026-08-31 00:00:00 UTC | $78,519.19 |
| 2026-09-08 00:00:00 UTC | $79,260.95 |
| 2026-09-17 00:00:00 UTC | $77,382.83 |
| 2026-09-25 00:00:00 UTC | $81,672.83 |
| 2026-10-03 00:00:00 UTC | $84,892.8 |
| 2026-10-11 00:00:00 UTC | $83,661.45 |
| 2026-10-19 00:00:00 UTC | $81,985.5 |
| 2026-10-20 00:00:00 UTC | $81,985.5 |
Quote this chart
The image is of the chart as you have it. The link is to the page, which opens on the published reading, so the sentence above is what tells a reader which interval and formula the quotation was taken on.
Maketo. Bitcoin Ichimoku Cloud (ichimoku; conversion 9, base 26, span 52, displacement 26), 1D candles, Maketo combined market. Last closed candle: 2026-10-20 00:00:00 UTC. Calculation version 1.0.0. https://maketo.com/technical-indicators/ichimoku
Source: <a href="https://maketo.com/technical-indicators/ichimoku">Maketo Bitcoin Ichimoku Cloud</a>
RIGHT NOW
Mixed, at $74,943. As of Oct 20, 2026.
What the day shows
At the 2026-10-20 UTC close, the reading was 74,942.8. The previous available reading was 74,808.8. This compares several midpoints of recent price ranges. The chart also shows their shifted lines.
How to read that number
Price above or below the cloud describes its position against past trading ranges. Conversion and base crossings show a shorter change within that wider picture.
What it was read at
Ichimoku, base 26, conversion 9, displacement 26, span 52, on daily candles. Change the interval or the settings on the chart above and every number there is recalculated in your browser. This sentence keeps the daily reading the page is published on.
Understanding
Bitcoin Ichimoku Cloud
Where it stands today
Ichimoku Cloud: mixed, at $74,943 as of .
What is Bitcoin Ichimoku Cloud?
Bitcoin Ichimoku Cloud places several high-low midpoint references on the price chart. The shorter and longer lines describe the centers of recent ranges. Two other lines create the cloud, a band that compares those earlier range references with today’s price. The chart brings these relationships together without turning them into one unexplained score.Maketo uses the 9/26/52 settings with a 26-candle displacement. These are midpoint calculations, not simple averages of closes. The shorter line averages the highest high and lowest low of nine candles; the longer line does the same over 26. The cloud visible at a given time comes from calculations made 26 candles earlier.
Compare price with both cloud edges
The upper cloud edge is whichever of the two cloud values is higher at that time; its identity can change. Price above both is above the historical reference band. Price below both is below it. Price between them is inside the band. A crossing describes that relationship, not proof that the band will stop a future move.
Check the shorter and longer range centers
The conversion line is the 9-candle midpoint and the base line is the 26-candle midpoint. A shorter line above the longer means the more recent range is centered higher. Because they use extremes, they can stay flat through several changing closes and then move when a high or low changes.
Read Maketo’s agreement rule
Rising requires the completed close above both cloud edges and the shorter midpoint above the longer one. Falling requires the close below both edges and the shorter midpoint below the longer one. Otherwise the summary is Mixed. A single line crossing is not sufficient for that combined direction label.
How Ichimoku Cloud is calculated
Conversion uses the 9-candle high-low midpoint; base uses 26. One cloud boundary averages those lines, and the other uses the 52-candle midpoint. Cloud lines are drawn 26 candles ahead. The page is published on Ichimoku, base 26, conversion 9, displacement 26, span 52. A period counts candles at the interval you choose, so the same setting covers a different stretch of time on a one-hour chart than on a daily one. How smoothing and missing candles are handled.
A calculation you can follow
These invented values distinguish the source calculation from where a cloud value is displayed. At a source candle, suppose the 9-candle high and low are $106,000 and $98,000. The conversion line is $102,000. If the 26-candle extremes are $110,000 and $90,000, the base line is $100,000.Cloud edge A is their midpoint: ($102,000 + $100,000) ÷ 2 = $101,000.If the 52-candle extremes are $112,000 and $84,000, edge B is ($112,000 + $84,000) ÷ 2 = $98,000. Both cloud values are displayed 26 candles after the source candle.At that later time, a close of $103,000 is above the historical $98,000–$101,000 cloud. The direction label also checks the conversion and base lines calculated at that later time, not the older pair used to create the cloud.Moving a historical calculation along the chart does not supply future prices. Every cloud value has a source time and a display time, and keeping them separate prevents accidental look-ahead interpretation.
The 9/26/52 periods
Each period controls a separate high-low range. A longer window can keep an old extreme in place, creating a flat reference even while recent closes move. Changing these numbers changes the reference ranges, not a preset prediction horizon.
Displacement 26
Maketo shows the cloud at observed candle timestamps using source values from 26 candles earlier. It does not extend unknown prices into future dates. This view displays the two midpoint lines and two cloud edges; a separate backward-shifted closing-price line is not part of its calculation output.
Warmup and interval
The slow cloud edge needs 52 candles for its source midpoint and another 26 positions for its displacement, so the first full default cloud needs 78 consecutive candles. On monthly or annual candles that can require much more history than Bitcoin has available. The period is not shortened to force a result.
Cloud thickness is not a probability band
The distance between its edges comes from two different range-midpoint calculations. It is not a confidence interval and does not say how likely price is to remain inside. A thick cloud and a thin cloud describe different historical reference gaps.
A range midpoint ignores time spent at each price
The highest high and lowest low receive equal weight even if one occurred briefly. The lines do not measure the average price paid by traders, the amount of trading at a level, or a collection of waiting orders.
Use matching timestamps
Comparing today’s price with an unshifted cloud source changes the method. Likewise, comparing an unfinished candle with a completed daily reading can create apparent disagreement. The dated reading uses the completed observation and its correctly displaced cloud.
Ichimoku Cloud compared with Simple Moving Average
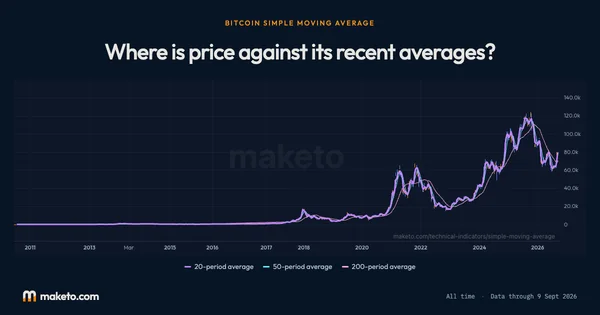
A simple moving average summarizes every close in a window. Ichimoku’s midpoint lines use just its highest high and lowest low. Compare them to see whether recent closes cluster away from the center suggested by the range extremes. Open Bitcoin Simple Moving Average.
Is the cloud a forecast of future Bitcoin prices?
No. Its displacement changes where historical midpoint calculations appear on the time axis. The values themselves contain no future observations.
Why can one Ichimoku line remain flat?
Its highest high and lowest low can remain unchanged while all intermediate prices move. Their midpoint stays fixed until one extreme changes or leaves the window.
The numbers
behind the chart
What does the current reading show?
Bitcoin price: the latest reading is $82,946, on . The highest reading since is $120,576 on ; the lowest is $0.0495 on .
Shorter average: the latest reading is $81,985, on . The highest reading since is $119,478 on ; the lowest is $0.0506 on .
Longer average: the latest reading is $83,469, on . The highest reading since is $118,210 on ; the lowest is $0.0545 on .
Cloud edge A: the latest reading is $81,171, on . The highest reading since is $118,768 on ; the lowest is $0.0525 on .
Cloud edge B: the latest reading is $74,943, on . The highest reading since is $116,744 on ; the lowest is $0.0570 on .
Readings since Jul 17, 2010 let you compare Oct 20, 2026 with earlier months. Highest and lowest cover every reading shown; month-end values use the last reading on or before that date. Every figure here is the published daily reading at Ichimoku, base 26, conversion 9, displacement 26, span 52, beside Bitcoin's own close on the same day. Change the interval or the settings on the chart above and the chart is recalculated in your browser, but this record is not. How Maketo measures the Bitcoin price.
What are the latest, highest and lowest readings?
| Measure | Latest | Highest | Lowest |
|---|---|---|---|
| Bitcoin price | $82,946 | $120,576 | $0.0495 |
| Shorter average | $81,985 | $119,478 | $0.0506 |
| Longer average | $83,469 | $118,210 | $0.0545 |
| Cloud edge A | $81,171 | $118,768 | $0.0525 |
| Cloud edge B | $74,943 | $116,744 | $0.0570 |
How do the readings compare with earlier dates?
| Reference date | Bitcoin price | Shorter average | Longer average | Cloud edge A | Cloud edge B |
|---|---|---|---|---|---|
| 1 month ago | $76,355 | $77,383 | $78,599 | $70,927 | $69,515 |
| 3 months ago | $64,989 | $63,168 | $61,648 | $66,271 | $70,969 |
| 6 months ago | $74,815 | $71,906 | $70,531 | $70,834 | $75,269 |
| 1 year ago | $108,663 | $109,761 | $114,879 | $113,649 | $115,881 |
| 2 years ago | $68,427 | $63,951 | $63,951 | $59,574 | $57,301 |
What was the reading at each month’s end?
| Reading date | Bitcoin price | Shorter average | Longer average | Cloud edge A | Cloud edge B |
|---|---|---|---|---|---|
| $84,093 | $81,673 | $81,155 | $75,252 | $71,622 | |
| $78,571 | $78,519 | $71,984 | $64,069 | $62,502 | |
| $64,723 | $64,691 | $64,098 | $61,547 | $69,894 | |
| $59,942 | $61,795 | $64,675 | $75,408 | $76,673 | |
| $75,825 | $76,163 | $78,520 | $75,128 | $72,233 | |
| $78,263 | $76,396 | $72,232 | $69,773 | $68,006 | |
| $66,767 | $68,502 | $70,495 | $68,302 | $78,966 | |
| $67,487 | $66,264 | $69,690 | $85,110 | $86,797 | |
| $89,157 | $91,534 | $92,352 | $88,998 | $94,030 | |
| $87,568 | $88,369 | $89,523 | $91,511 | $98,484 | |
| $90,897 | $86,844 | $95,659 | $112,609 | $114,879 | |
| $114,104 | $111,253 | $114,879 | $113,655 | $115,881 | |
| $113,323 | $114,497 | $112,596 | $114,218 | $115,990 | |
| $108,248 | $112,187 | $115,934 | $116,720 | $110,721 | |
| $117,939 | $117,495 | $115,245 | $106,121 | $105,101 | |
| $107,077 | $103,265 | $104,416 | $105,409 | $95,473 | |
| $109,451 | $107,041 | $102,683 | $88,292 | $85,140 | |
| $93,711 | $88,901 | $84,583 | $85,737 | $88,384 | |
| $82,385 | $85,164 | $84,706 | $88,282 | $93,850 | |
| $88,632 | $92,749 | $96,015 | $100,877 | $99,305 | |
| $104,861 | $103,394 | $99,305 | $98,006 | $91,992 | |
| $92,710 | $95,674 | $99,821 | $91,325 | $81,073 | |
| $95,652 | $95,230 | $83,252 | $67,925 | $65,474 | |
| $67,053 | $67,355 | $64,205 | $61,980 | $59,521 |
Keep exploring



Source: Calculated by Maketo on one combined spot market, daily candles. Reading for .