

BITCOIN SIMPLE MOVING AVERAGE
Where is price against its recent averages?
Falling, at $83,215. As of Oct 20, 2026.
Bitcoin Simple Moving Average
Daily candles
1D candles. Last closed candle: 2026-10-20 00:00:00 UTC.
Drag to zoom, shift and drag to pan. Click the chart before scrolling to zoom with the wheel, and press Escape to let the page scroll again. The candle interval changes the calculation; the range buttons change only the dates on screen.
A simple moving average gives equal weight to each close in a chosen window. Comparing several windows shows how the recent price path differs from a slower one. Pick a candle interval and the chart recalculates.
Change the calculation
The last twelve readings as a table
| Candle start, UTC | 20-period average |
|---|---|
| 2026-08-04 00:00:00 UTC | $64,329.17 |
| 2026-08-11 00:00:00 UTC | $64,129.15 |
| 2026-08-19 00:00:00 UTC | $64,087.94 |
| 2026-08-27 00:00:00 UTC | $69,716.91 |
| 2026-09-03 00:00:00 UTC | $74,779.32 |
| 2026-09-11 00:00:00 UTC | $78,613.63 |
| 2026-09-19 00:00:00 UTC | $78,321.94 |
| 2026-09-26 00:00:00 UTC | $80,165.42 |
| 2026-10-04 00:00:00 UTC | $82,859.97 |
| 2026-10-11 00:00:00 UTC | $84,233.96 |
| 2026-10-19 00:00:00 UTC | $83,245.63 |
| 2026-10-20 00:00:00 UTC | $83,214.7 |
Quote this chart
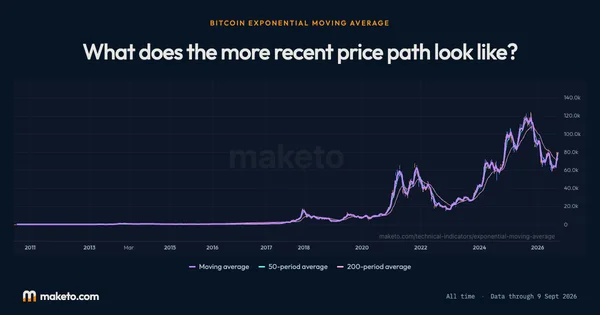
The image is of the chart as you have it. The link is to the page, which opens on the published reading, so the sentence above is what tells a reader which interval and formula the quotation was taken on.
Maketo. Bitcoin Simple Moving Average (sma; period 20, medium 50, long 200), 1D candles, Maketo combined market. Last closed candle: 2026-10-20 00:00:00 UTC. Calculation version 1.0.0. https://maketo.com/technical-indicators/simple-moving-average
Source: <a href="https://maketo.com/technical-indicators/simple-moving-average">Maketo Bitcoin Simple Moving Average</a>
RIGHT NOW
Falling, at $83,215. As of Oct 20, 2026.
What the day shows
At the 2026-10-20 UTC close, the reading was 83,214.7. The previous available reading was 83,245.6. Each completed daily close has the same weight in this price average. The selected period is 20 daily candles.
How to read that number
Price above an average is above that window’s mean close. A faster average crossing a slower one describes a change already built from past closes.
What it was read at
Simple moving average, long 200, medium 50, period 20, on daily candles. Change the interval or the settings on the chart above and every number there is recalculated in your browser. This sentence keeps the daily reading the page is published on.
Understanding
Bitcoin Simple Moving Average
Where it stands today
Simple Moving Average: falling, at $83,215 as of .
What is Bitcoin Simple Moving Average?
A Bitcoin simple moving average, or SMA, is the mean of a fixed number of closing prices. Every close in its window receives equal weight. As a new candle arrives, its close enters the window and the oldest leaves. The line makes the broad price path easier to compare with current price while deliberately reducing individual-candle detail.Maketo’s default view displays 20-, 50- and 200-period averages. They are three views of the same closing-price history, not three separate data sources. A shorter average usually responds sooner to a recent change, while a longer one preserves more of the earlier path. The familiar 50/200 crossing and triangular smoothing are selectable variants on this page.
Separate price position from the average’s direction
A close above its average means it is above the mean close for that window. The average can still be falling. Conversely, a close below a rising average is possible after a recent dip. Describing both relationships gives more information than saying simply that price crossed a line.
Read the default summary rule
Maketo uses the primary 20-period line for the default page label. Rising requires the close above that line and the line above its value five candles earlier. Falling requires both comparisons below. Other combinations are Mixed. The 50- and 200-period lines provide context rather than extra votes.
Treat a crossing as a dated comparison
The 50/200 variant compares the shorter average with the longer one. It records a crossing above only when the previous shorter value was at or below the longer and the current value is above; a crossing below uses the reverse rule. Events use completed candles. Remaining above for another day is not a new crossing.
How Simple Moving Average is calculated
SMA is the sum of closes divided by the number of candles. The default chart shows 20, 50 and 200 periods. The triangular variant applies a two-stage simple smoothing. The page is published on Simple moving average, long 200, medium 50, period 20. A period counts candles at the interval you choose, so the same setting covers a different stretch of time on a one-hour chart than on a daily one. How smoothing and missing candles are handled.
A calculation you can follow
A three-period example makes the rolling-window update visible. The default chart uses longer windows. Take closes of $90,000, $100,000 and $110,000. Their simple average is $300,000 ÷ 3 = $100,000.If the next close is $105,000, the new window is $100,000, $110,000 and $105,000. Its average is $105,000.The latest close fell from $110,000 to $105,000, yet the average rose by $5,000 because the departing $90,000 was replaced by $105,000.The update identity is new SMA − old SMA = (new close − departing close) ÷ period. Here ($105,000 − $90,000) ÷ 3 = $5,000.The direction of an SMA depends on the incoming close relative to the departing close, not just on whether the latest candle rose or fell.
20, 50 and 200 periods
These are candle counts. A 200-hour average uses 200 hourly closes; a 200-day average uses 200 daily closes. The latter is not created by simply drawing the same hourly average on a wider chart. Higher-timeframe closes select different observations.
Triangular smoothing
This variant applies two simple averages with lengths chosen to give the configured total window. For period 20, Maketo first uses 10 and then 11. That gives more weight to the middle of the effective window than to its ends. Its direction uses the same price-versus-line and five-candle comparisons as the default SMA, applied to the triangular line.
The 50/200 crossing view
Its default shorter and longer windows are 50 and 200, and its direction label follows which average is higher. It does not apply the default single-line price-and-slope rule. Both averages need enough complete history; the longer period is never shortened to manufacture a crossing.
An average is not a guaranteed stopping price
Many readers compare price with common averages, but the calculation itself contains no waiting orders or promise that price will hold a line. It records the mean of past closes, regardless of what happens next.
Crossings can follow much of a move
A longer average changes gradually because many older closes remain inside it. The shorter average may cross only after price has already moved considerably. The crossing date describes when the averages changed order, not when the underlying move began.
Similar averages are shared evidence
The 20, 50 and 200 windows overlap, as do different smoothing variants built from the same closes. Listing their agreement is useful context, but counting every line as independent confirmation exaggerates how many distinct facts are being measured.
Simple Moving Average compared with Exponential Moving Average
An EMA gives newer closes more weight and lets older contributions fade. An SMA weights its full window equally, then drops the oldest close completely. Compare the same period and interval to see the difference between gradual fading and a fixed-window departure. Open Bitcoin Exponential Moving Average.
Why can the average rise while the newest candle falls?
The entering close may still be higher than the close leaving the window. That replacement raises the average even when the newest close is below the immediately previous one.
Is triangular smoothing the same as averaging 20 closes twice?
Not here. The lengths are chosen to produce an effective 20-candle window: 10 followed by 11. Two consecutive 20-period averages would require a longer effective window and produce different weights.
The numbers
behind the chart
What does the current reading show?
Bitcoin price: the latest reading is $82,946, on . The highest reading since is $122,274 on ; the lowest is $0.0495 on .
20-period average: the latest reading is $83,215, on . The highest reading since is $117,426 on ; the lowest is $0.0618 on .
50-period average: the latest reading is $81,571, on . The highest reading since is $116,573 on ; the lowest is $0.0628 on .
200-period average: the latest reading is $72,652, on . The highest reading since is $110,418 on ; the lowest is $0.1788 on .
Readings since Jul 17, 2010 let you compare Oct 20, 2026 with earlier months. Highest and lowest cover every reading shown; month-end values use the last reading on or before that date. Every figure here is the published daily reading at Simple moving average, long 200, medium 50, period 20, beside Bitcoin's own close on the same day. Change the interval or the settings on the chart above and the chart is recalculated in your browser, but this record is not. How Maketo measures the Bitcoin price.
What are the latest, highest and lowest readings?
| Measure | Latest | Highest | Lowest |
|---|---|---|---|
| Bitcoin price | $82,946 | $122,274 | $0.0495 |
| 20-period average | $83,215 | $117,426 | $0.0618 |
| 50-period average | $81,571 | $116,573 | $0.0628 |
| 200-period average | $72,652 | $110,418 | $0.1788 |
How do the readings compare with earlier dates?
| Reference date | Bitcoin price | 20-period average | 50-period average | 200-period average |
|---|---|---|---|---|
| 1 month ago | $81,235 | $78,322 | $72,842 | $70,466 |
| 3 months ago | $65,216 | $63,472 | $63,193 | $72,941 |
| 6 months ago | $73,815 | $71,607 | $70,368 | $86,568 |
| 1 year ago | $108,663 | $116,035 | $114,191 | $107,753 |
| 2 years ago | $68,427 | $63,427 | $61,369 | $63,310 |
What was the reading at each month’s end?
| Reading date | Bitcoin price | 20-period average | 50-period average | 200-period average |
|---|---|---|---|---|
| $84,433 | $80,165 | $75,716 | $71,006 | |
| $80,266 | $69,717 | $66,430 | $69,231 | |
| $63,698 | $64,327 | $63,274 | $72,006 | |
| $59,942 | $63,048 | $69,832 | $75,854 | |
| $74,337 | $78,277 | $77,125 | $80,144 | |
| $77,371 | $75,230 | $71,806 | $84,767 | |
| $66,381 | $70,263 | $68,948 | $91,543 | |
| $67,991 | $67,996 | $79,689 | $98,165 | |
| $88,299 | $91,568 | $90,094 | $104,984 | |
| $87,329 | $88,814 | $91,446 | $107,485 | |
| $90,480 | $94,546 | $104,134 | $109,973 | |
| $114,553 | $112,417 | $114,226 | $108,786 | |
| $109,670 | $114,031 | $114,050 | $104,164 | |
| $111,780 | $116,315 | $116,573 | $100,931 | |
| $119,452 | $117,426 | $110,948 | $98,567 | |
| $106,983 | $105,831 | $105,702 | $96,089 | |
| $108,958 | $105,944 | $96,182 | $94,304 | |
| $94,647 | $86,000 | $84,672 | $89,027 | |
| $87,224 | $84,248 | $89,594 | $85,550 | |
| $91,544 | $96,423 | $98,809 | $81,489 | |
| $104,739 | $99,881 | $98,901 | $76,233 | |
| $95,735 | $99,599 | $95,051 | $70,868 | |
| $93,006 | $88,715 | $75,670 | $66,052 | |
| $67,053 | $65,556 | $62,980 | $63,279 |
Keep exploring



Source: Calculated by Maketo on one combined spot market, daily candles. Reading for .