

BITCOIN LINEAR REGRESSION
What straight line best fits the recent prices?
Rising, at $87,572. As of Oct 20, 2026.
Bitcoin Linear Regression
Daily candles
1D candles. Last closed candle: 2026-10-20 00:00:00 UTC.
Drag to zoom, shift and drag to pan. Click the chart before scrolling to zoom with the wheel, and press Escape to let the page scroll again. The candle interval changes the calculation; the range buttons change only the dates on screen.
Linear regression fits a straight line through recent closes. Its slope describes the fitted direction; the channel describes how widely the closes sit around that line. Pick a candle interval and the chart recalculates.
Change the calculation
The last twelve readings as a table
| Candle start, UTC | Fitted price |
|---|---|
| 2026-08-09 00:00:00 UTC | $58,761.98 |
| 2026-08-16 00:00:00 UTC | $59,395.82 |
| 2026-08-23 00:00:00 UTC | $62,990.36 |
| 2026-08-30 00:00:00 UTC | $67,974.44 |
| 2026-09-07 00:00:00 UTC | $73,462.01 |
| 2026-09-14 00:00:00 UTC | $76,301.14 |
| 2026-09-21 00:00:00 UTC | $78,922.7 |
| 2026-09-28 00:00:00 UTC | $82,548.18 |
| 2026-10-05 00:00:00 UTC | $85,210.87 |
| 2026-10-12 00:00:00 UTC | $86,588.46 |
| 2026-10-19 00:00:00 UTC | $87,447.81 |
| 2026-10-20 00:00:00 UTC | $87,572.44 |
Quote this chart
The image is of the chart as you have it. The link is to the page, which opens on the published reading, so the sentence above is what tells a reader which interval and formula the quotation was taken on.
Maketo. Bitcoin Linear Regression (regression; period 100, deviations 2), 1D candles, Maketo combined market. Last closed candle: 2026-10-20 00:00:00 UTC. Calculation version 1.0.0. https://maketo.com/technical-indicators/linear-regression
Source: <a href="https://maketo.com/technical-indicators/linear-regression">Maketo Bitcoin Linear Regression</a>
RIGHT NOW
Rising, at $87,572. As of Oct 20, 2026.
What the day shows
At the 2026-10-20 UTC close, the reading was 87,572.4. The previous available reading was 87,447.8. This fits a straight line through recent daily prices to show their overall path. The selected period is 100 daily candles.
How to read that number
Compare price with the fitted line and read slope in the units of the selected candle interval. The channel shows past scatter around a simple straight path.
What it was read at
Regression channel, deviations 2, period 100, on daily candles. Change the interval or the settings on the chart above and every number there is recalculated in your browser. This sentence keeps the daily reading the page is published on.
Understanding
Bitcoin Linear Regression
Where it stands today
Linear Regression: rising, at $87,572 as of .
What is Bitcoin Linear Regression?
Bitcoin linear regression fits a straight line through a chosen window of closing prices. The line is selected by minimizing the sum of squared distances between each close and its fitted value. It describes the average direction of that window while allowing individual candles to sit above or below the fitted path.Maketo’s default fits 100 candles and displays the fitted endpoint with two surrounding channel lines. A separate slope view reports the fitted dollar change per candle, also over 100 candles. The forecast view uses 14 candles by default and extends its fitted line one position forward. That extension is arithmetic, not an estimate with demonstrated predictive odds.
Read slope as dollars per candle
Positive slope means the fitted line points upward through the selected window; negative slope means downward. Its unit depends on the candle interval: $100 per hour and $100 per day are different rates. Maketo’s direction label follows the slope sign in all three views, not price’s position relative to the channel.
Understand the channel width
For every close, subtract the fitted value at that candle to obtain a residual, its distance from the fitted line. Maketo squares those residuals, averages them over the full window, and takes the square root. The default channel places two times that residual spread above and below the fitted endpoint.
Read a rolling fit rather than one permanent line
Each new candle produces a new fitted window and a new endpoint. The plotted history connects those successive endpoints, so it can curve even though each individual window was fitted with a straight line. It is not one straight trend line drawn across the entire visible chart.
How Linear Regression is calculated
Choose the line that minimizes squared distances from the last 100 closes. Channel boundaries sit two residual standard deviations from the fit. The forecast variant extends a fitted line by one step. The page is published on Regression channel, deviations 2, period 100. A period counts candles at the interval you choose, so the same setting covers a different stretch of time on a one-hour chart than on a daily one. How smoothing and missing candles are handled.
A calculation you can follow
Five invented closes keep the fit reproducible by hand. This demonstration uses period 5, not the live 100-candle default. Take closes of $100,000, $102,000, $101,000, $104,000 and $103,000. Give them positions 0, 1, 2, 3 and 4. Mean position is 2 and mean close is $102,000.Slope is the sum of (position − 2) × (close − $102,000), divided by the sum of (position − 2) squared. Those totals are $8,000 and 10, giving $800 per candle.The intercept is $102,000 − $800 × 2 = $100,400. The fitted endpoint at position 4 is $103,600; extending the same fit to position 5 gives $104,400.Residuals are −$400, +$800, −$1,000, +$1,200 and −$600. Their squared mean is 720,000 square dollars, giving a residual spread of about $848.53. Two spreads around the $103,600 endpoint give approximately $101,902.94 and $105,297.06.The actual final close is $103,000, below the fitted endpoint, while the fitted slope is positive. Price position and the window’s fitted direction are different facts.
Period 100 for fit and slope
A longer fit includes more historical conditions and can obscure a recent change of direction. A shorter fit responds more to individual candles. The least-squares calculation uses equally spaced candle positions, not the number of trades or how much time price spent at a level.
Channel multiplier 2
This changes only the distance of the channel edges from the fitted endpoint. It does not change the fitted line or slope. Two residual spreads are not automatically a 95% forecast interval: that interpretation would require statistical assumptions and a different predictive calculation.
Forecast period 14
The forecast preset is a shorter fit, evaluated one candle beyond its endpoint. To compare fit, slope and extension from the exact same window, set their periods equally. The page does not establish that the next close will reach the extended value.
An unusual close can rotate the fit
Squared distances give larger departures more influence. A large move near either end of the window can meaningfully change the slope and endpoint. Check the actual candles rather than assuming a neatly fitted line means the path was steady.
Residual spread differs from price spread
A strong, nearly straight rise can have a small residual spread despite covering a large dollar range. The channel measures departures from the fitted path, not distance from one horizontal average price.
A gap is not a hidden extra observation
Missing candles interrupt the fit. Maketo does not fill a missing price with a repeated close or stretch the same five observations across an unknown interval. Enough consecutive candles must exist for the selected period.
Linear Regression compared with Bollinger Bands
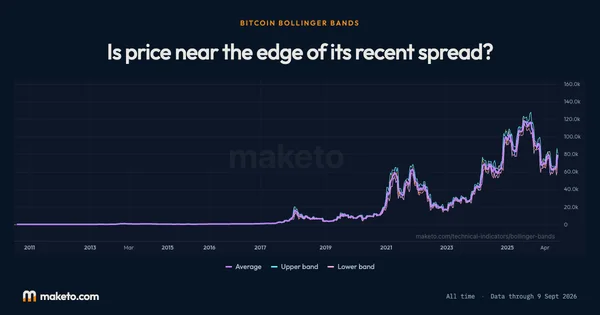
Bollinger Bands measure close dispersion around a horizontal moving average. Regression channels measure departures from a sloping fitted path. Their widths can differ greatly during an orderly rise or fall; they answer different questions about the shape of price movement. Open Bitcoin Bollinger Bands.
Why is the displayed regression history curved?
Each point is the endpoint of a newly fitted rolling window. Connecting those changing endpoints creates a path, although the fit inside each window is straight.
Does the forecast come from a trained prediction model?
No. It is the current least-squares line extended by one candle position. It adds no future data, market assumptions, or probability estimate.
The numbers
behind the chart
What does the current reading show?
Bitcoin price: the latest reading is $82,946, on . The highest reading since is $123,334 on ; the lowest is $0.0495 on .
Fitted price: the latest reading is $87,572, on . The highest reading since is $119,082 on ; the lowest is $0.0846 on .
Upper channel: the latest reading is $95,043, on . The highest reading since is $126,291 on ; the lowest is $0.1095 on .
Lower channel: the latest reading is $80,102, on . The highest reading since is $112,182 on ; the lowest is −$1.15 on .
Readings since Jul 17, 2010 let you compare Oct 20, 2026 with earlier months. Highest and lowest cover every reading shown; month-end values use the last reading on or before that date. Every figure here is the published daily reading at Regression channel, deviations 2, period 100, beside Bitcoin's own close on the same day. Change the interval or the settings on the chart above and the chart is recalculated in your browser, but this record is not. How Maketo measures the Bitcoin price.
What are the latest, highest and lowest readings?
| Measure | Latest | Highest | Lowest |
|---|---|---|---|
| Bitcoin price | $82,946 | $123,334 | $0.0495 |
| Fitted price | $87,572 | $119,082 | $0.0846 |
| Upper channel | $95,043 | $126,291 | $0.1095 |
| Lower channel | $80,102 | $112,182 | −$1.15 |
How do the readings compare with earlier dates?
| Reference date | Bitcoin price | Fitted price | Upper channel | Lower channel |
|---|---|---|---|---|
| 1 month ago | $78,189 | $76,301 | $84,537 | $68,066 |
| 3 months ago | $64,682 | $59,921 | $68,413 | $51,429 |
| 6 months ago | $75,718 | $64,204 | $78,357 | $50,051 |
| 1 year ago | $108,197 | $114,163 | $121,634 | $106,692 |
| 2 years ago | $69,023 | $62,139 | $69,573 | $54,706 |
What was the reading at each month’s end?
| Reading date | Bitcoin price | Fitted price | Upper channel | Lower channel |
|---|---|---|---|---|
| $83,463 | $82,548 | $89,922 | $75,174 | |
| $77,682 | $67,974 | $78,928 | $57,021 | |
| $65,341 | $59,169 | $67,487 | $50,852 | |
| $59,490 | $67,300 | $79,384 | $55,216 | |
| $73,771 | $79,697 | $85,432 | $73,962 | |
| $77,632 | $67,635 | $81,712 | $53,558 | |
| $66,345 | $63,253 | $75,242 | $51,265 | |
| $65,870 | $71,819 | $85,066 | $58,571 | |
| $84,192 | $84,645 | $96,178 | $73,111 | |
| $87,329 | $83,441 | $93,329 | $73,553 | |
| $91,328 | $98,311 | $111,655 | $84,967 | |
| $108,310 | $112,233 | $120,083 | $104,383 | |
| $109,008 | $115,967 | $124,846 | $107,088 | |
| $111,258 | $118,574 | $126,217 | $110,930 | |
| $117,835 | $117,964 | $125,061 | $110,868 | |
| $107,370 | $111,781 | $121,058 | $102,504 | |
| $108,958 | $100,937 | $114,929 | $86,944 | |
| $94,264 | $81,353 | $92,302 | $70,404 | |
| $87,421 | $86,358 | $96,267 | $76,449 | |
| $91,544 | $99,013 | $106,184 | $91,843 | |
| $102,079 | $108,028 | $122,055 | $94,001 | |
| $92,710 | $106,091 | $117,732 | $94,449 | |
| $97,954 | $83,775 | $96,443 | $71,107 | |
| $67,982 | $63,792 | $71,372 | $56,212 |
Keep exploring



Source: Calculated by Maketo on one combined spot market, daily candles. Reading for .