

BITCOIN PARABOLIC SAR
Where does the trailing price marker sit?
Falling, at $84,010. As of Oct 20, 2026.
Bitcoin Parabolic SAR
Daily candles
1D candles. Last closed candle: 2026-10-20 00:00:00 UTC.
Drag to zoom, shift and drag to pan. Click the chart before scrolling to zoom with the wheel, and press Escape to let the page scroll again. The candle interval changes the calculation; the range buttons change only the dates on screen.
Parabolic SAR follows a move with a trailing reference that moves closer as the move continues. A crossing changes which side of price the marker occupies. Pick a candle interval and the chart recalculates.
Change the calculation
The last twelve readings as a table
| Candle start, UTC | Parabolic SAR |
|---|---|
| 2026-08-06 00:00:00 UTC | $62,272.39 |
| 2026-08-14 00:00:00 UTC | $65,373.48 |
| 2026-08-21 00:00:00 UTC | $63,472.97 |
| 2026-08-28 00:00:00 UTC | $72,442.03 |
| 2026-09-05 00:00:00 UTC | $76,357.86 |
| 2026-09-12 00:00:00 UTC | $81,923.04 |
| 2026-09-19 00:00:00 UTC | $75,042.93 |
| 2026-09-27 00:00:00 UTC | $79,246.11 |
| 2026-10-04 00:00:00 UTC | $82,110.86 |
| 2026-10-12 00:00:00 UTC | $86,251.8 |
| 2026-10-19 00:00:00 UTC | $84,284.24 |
| 2026-10-20 00:00:00 UTC | $84,009.73 |
Quote this chart
The image is of the chart as you have it. The link is to the page, which opens on the published reading, so the sentence above is what tells a reader which interval and formula the quotation was taken on.
Maketo. Bitcoin Parabolic SAR (sar; step 0.02, maximum 0.2), 1D candles, Maketo combined market. Last closed candle: 2026-10-20 00:00:00 UTC. Calculation version 1.0.0. https://maketo.com/technical-indicators/parabolic-sar
Source: <a href="https://maketo.com/technical-indicators/parabolic-sar">Maketo Bitcoin Parabolic SAR</a>
RIGHT NOW
Falling, at $84,010. As of Oct 20, 2026.
What the day shows
At the 2026-10-20 UTC close, the reading was 84,009.7. The previous available reading was 84,284.2. This follows a moving price level that changes sides when price crosses it.
How to read that number
A marker below price follows an upward state; a marker above price follows a downward state. A side switch records that the prior trail was crossed.
What it was read at
Parabolic SAR, maximum 0.2, step 0.02, on daily candles. Change the interval or the settings on the chart above and every number there is recalculated in your browser. This sentence keeps the daily reading the page is published on.
Understanding
Bitcoin Parabolic SAR
Where it stands today
Parabolic SAR: falling, at $84,010 as of .
What is Bitcoin Parabolic SAR?
Bitcoin Parabolic SAR draws a trailing price reference that changes sides when the candle range crosses it. During an upward phase, the reference sits below prices and moves toward a tracked high. During a downward phase, it sits above prices and moves toward a tracked low. Its changing distance comes from a defined acceleration rule, not from observed orders.The default step is 0.02 and the maximum acceleration is 0.20. The acceleration factor increases as new extremes extend the current phase, up to that cap. When the rule changes sides, the factor resets. This gives SAR memory: the same current candle can produce a different line if the preceding phase and extremes were different.
Read the side of the line first
A close above SAR is above the active trailing reference; a close below is below it. Maketo uses those comparisons for Rising and Falling, with equality Mixed. The label does not measure how large the price move was or how long the current phase has lasted.
Understand what moves the reference
The basic update adds acceleration × (tracked extreme − previous SAR) to the previous SAR. In an upward phase the extreme is the highest high reached during that phase. In a downward phase it is the lowest low. A new extreme increases the factor by the configured step, subject to the maximum.
Recognize the extra range rules
The simple update is constrained by recent candle ranges so the reference does not move through their nearby lows or highs. When the current range crosses the active reference, the phase changes and the line is reset using the prior extreme and relevant candle bounds. A wick can cause this change even if the close later moves back.
How Parabolic SAR is calculated
Each step moves the prior marker toward the running price extreme using an acceleration factor. Defaults start at 0.02, increase with new extremes and cap at 0.2. The page is published on Parabolic SAR, maximum 0.2, step 0.02. A period counts candles at the interval you choose, so the same setting covers a different stretch of time on a one-hour chart than on a daily one. How smoothing and missing candles are handled.
A calculation you can follow
This invented update assumes an established upward phase and no range constraint that would alter the candidate. Suppose the prior SAR is $90,000, the tracked highest high is $100,000, and the current acceleration factor is 0.04.The gap to the extreme is $10,000. Multiply by 0.04 to get a $400 step; the candidate next reference is $90,400.If the recent lows used by the constraint are $93,000 and $94,000, the candidate remains below both, so they do not reduce it.If a later new extreme lifts the acceleration factor to 0.06, the next update uses that larger factor. If the candle range instead crosses the active reference, the reset rule applies rather than continuing the same arithmetic.The acceleration setting controls movement toward a changing reference extreme. A value of 0.04 is not a 4% distance below Bitcoin’s price.
Step 0.02
The step is the initial acceleration and the increment applied when the current phase extends to a new extreme. A larger step generally makes the reference approach that extreme more quickly, increasing the chance that ordinary back-and-forth movement changes its side.
Maximum 0.20
The maximum caps the acceleration factor, not the dollar gap or number of candles in a phase. The step must be positive and no larger than this maximum. A higher cap allows later updates in an extended phase to react more strongly.
Starting history and timeframe
Maketo uses the first two candles to establish the initial phase and reference, with the first output on the second candle. The subsequent path depends on later extremes and resets. Higher-timeframe candles have different highs and lows, so aggregating candles can change when the reference changes sides.
Alternating ranges can produce repeated side changes
When price moves back and forth through a narrow area, the trailing reference can switch repeatedly. Those switches describe the formula’s response to recent ranges. They do not establish that each short phase was a durable trend.
A line is not an executed order
SAR is a calculated chart value. It does not show an actual order, an available trading price, or whether an order could have been filled at that level. A candle that crosses the line only establishes that its recorded range reached it.
Check initialization before comparing platforms
Initial direction, extreme selection, acceleration updates, equality handling and range constraints can produce differences between implementations. Matching 0.02/0.20 alone does not prove the same numerical conventions or starting candle were used.
Parabolic SAR compared with Supertrend
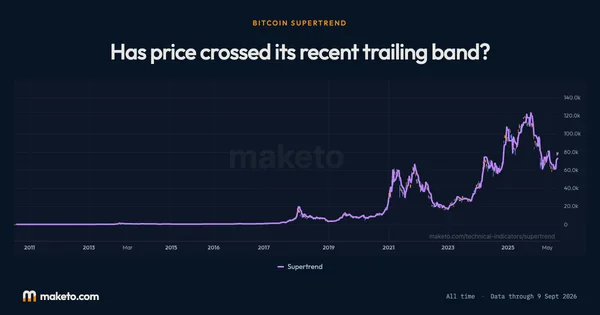
Supertrend builds its trailing references from average candle ranges and a multiplier. SAR moves toward phase extremes with an increasing acceleration factor. Their side changes can differ because they measure and update their reference distances differently. Open Bitcoin Supertrend.
Can a wick change SAR’s side?
Yes. The side-change rule checks candle highs and lows against the reference. It is not limited to closing-price crossings.
Does the acceleration factor measure trend strength?
It is an internal update weight that rises when the current phase reaches new extremes. It is not a separately normalized strength measurement like ADX.
The numbers
behind the chart
What does the current reading show?
Bitcoin price: the latest reading is $82,946, on . The highest reading since is $123,325 on ; the lowest is $0.0495 on .
Parabolic SAR: the latest reading is $84,010, on . The highest reading since is $124,355 on ; the lowest is $0.0321 on .
Readings since Jul 17, 2010 let you compare Oct 20, 2026 with earlier months. Highest and lowest cover every reading shown; month-end values use the last reading on or before that date. Every figure here is the published daily reading at Parabolic SAR, maximum 0.2, step 0.02, beside Bitcoin's own close on the same day. Change the interval or the settings on the chart above and the chart is recalculated in your browser, but this record is not. How Maketo measures the Bitcoin price.
What are the latest, highest and lowest readings?
| Measure | Latest | Highest | Lowest |
|---|---|---|---|
| Bitcoin price | $82,946 | $123,325 | $0.0495 |
| Parabolic SAR | $84,010 | $124,355 | $0.0321 |
How do the readings compare with earlier dates?
| Reference date | Bitcoin price | Parabolic SAR |
|---|---|---|
| 1 month ago | $81,235 | $75,043 |
| 3 months ago | $64,717 | $61,018 |
| 6 months ago | $75,718 | $72,524 |
| 1 year ago | $110,784 | $124,148 |
| 2 years ago | $68,427 | $60,457 |
What was the reading at each month’s end?
| Reading date | Bitcoin price | Parabolic SAR |
|---|---|---|
| $84,462 | $79,246 | |
| $77,842 | $72,442 | |
| $64,723 | $66,149 | |
| $58,532 | $64,490 | |
| $76,980 | $78,549 | |
| $77,632 | $74,071 | |
| $68,800 | $75,340 | |
| $67,991 | $72,057 | |
| $88,299 | $94,447 | |
| $87,914 | $90,833 | |
| $90,897 | $81,939 | |
| $108,310 | $116,093 | |
| $114,057 | $108,628 | |
| $113,484 | $119,099 | |
| $117,941 | $120,864 | |
| $106,983 | $98,411 | |
| $107,797 | $111,674 | |
| $95,028 | $88,430 | |
| $82,385 | $79,904 | |
| $84,330 | $96,866 | |
| $104,733 | $108,784 | |
| $93,479 | $104,844 | |
| $97,954 | $93,761 | |
| $67,053 | $65,555 |
Keep exploring


Source: Calculated by Maketo on one combined spot market, daily candles. Reading for .