

BITCOIN SUPERTREND
Has price crossed its recent trailing band?
Rising, at $79,628. As of Oct 20, 2026.
Bitcoin Supertrend
Daily candles
1D candles. Last closed candle: 2026-10-20 00:00:00 UTC.
Drag to zoom, shift and drag to pan. Click the chart before scrolling to zoom with the wheel, and press Escape to let the page scroll again. The candle interval changes the calculation; the range buttons change only the dates on screen.
Supertrend creates a trailing band around the candle midpoint using the recent size of price swings. Its state changes when price closes across the relevant band. Pick a candle interval and the chart recalculates.
Change the calculation
The last twelve readings as a table
| Candle start, UTC | Supertrend |
|---|---|
| 2026-08-05 00:00:00 UTC | $61,128.88 |
| 2026-08-13 00:00:00 UTC | $61,258.99 |
| 2026-08-20 00:00:00 UTC | $65,337.1 |
| 2026-08-28 00:00:00 UTC | $72,311.36 |
| 2026-09-04 00:00:00 UTC | $72,311.36 |
| 2026-09-12 00:00:00 UTC | $72,783.78 |
| 2026-09-19 00:00:00 UTC | $74,522.42 |
| 2026-09-27 00:00:00 UTC | $78,329.27 |
| 2026-10-04 00:00:00 UTC | $79,257.31 |
| 2026-10-12 00:00:00 UTC | $79,627.73 |
| 2026-10-19 00:00:00 UTC | $79,627.73 |
| 2026-10-20 00:00:00 UTC | $79,627.73 |
Quote this chart
The image is of the chart as you have it. The link is to the page, which opens on the published reading, so the sentence above is what tells a reader which interval and formula the quotation was taken on.
Maketo. Bitcoin Supertrend (supertrend; period 10, multiplier 3), 1D candles, Maketo combined market. Last closed candle: 2026-10-20 00:00:00 UTC. Calculation version 1.0.0. https://maketo.com/technical-indicators/supertrend
Source: <a href="https://maketo.com/technical-indicators/supertrend">Maketo Bitcoin Supertrend</a>
RIGHT NOW
Rising, at $79,628. As of Oct 20, 2026.
What the day shows
At the 2026-10-20 UTC close, the reading was 79,627.7. The previous available reading was 79,627.7. This follows a price boundary whose distance expands when daily price swings get larger. The selected period is 10 daily candles.
How to read that number
The band’s side describes the current rule-based direction. The gap from price reflects both recent price swings and how far the move has travelled.
What it was read at
Supertrend, multiplier 3, period 10, on daily candles. Change the interval or the settings on the chart above and every number there is recalculated in your browser. This sentence keeps the daily reading the page is published on.
Understanding
Bitcoin Supertrend
Where it stands today
Supertrend: rising, at $79,628 as of .
What is Bitcoin Supertrend?
Bitcoin Supertrend compares price with a trailing reference built from the midpoint of each candle and its recent average range. It maintains an upper and a lower candidate band, but displays one active line at a time. A completed close crossing the active band can switch which line is shown.The default uses a 10-period Average True Range and a multiplier of 3. Average True Range, or ATR, smooths the size of candle movements while allowing for the previous close. This gives the reference an adjustable distance that responds to how widely Bitcoin has been moving, rather than a fixed dollar or percentage distance.
Begin with the two basic bands
The candle midpoint is (high + low) ÷ 2. The basic upper band is midpoint + multiplier × ATR; the basic lower band is midpoint − multiplier × ATR. These are ingredients for the final trailing bands. They are not automatically the line displayed on the chart.
Account for the trailing memory
The final upper band keeps its prior value unless the new basic upper band is lower or the previous close exceeded the prior upper band. The final lower keeps its prior value unless the new basic lower is higher or the previous close fell below the prior lower. These rules let the band carry a reference forward rather than jump with every midpoint.
Read the active side
While the upper band is active, a close above it switches the displayed line to the lower band. While the lower is active, a close below it switches to the upper. Maketo describes price above the active line as Rising, below it as Falling, and equality as Mixed. The line is a calculated reference, not a guaranteed floor or ceiling.
How Supertrend is calculated
Start with (high + low) / 2 plus or minus 3 times the 10-period average true range, then carry forward the band according to the previous state. The page is published on Supertrend, multiplier 3, period 10. A period counts candles at the interval you choose, so the same setting covers a different stretch of time on a one-hour chart than on a daily one. How smoothing and missing candles are handled.
A calculation you can follow
These invented inputs show why the final bands can differ from the freshly calculated basic bands. Suppose a candle’s midpoint is $100,000 and its initialized 10-period ATR is $1,000. With multiplier 3, the basic bands are $103,000 and $97,000.Suppose the previous final upper and lower bands were $102,000 and $98,000, and the previous close was $100,000.The new basic upper is not lower than $102,000, and the previous close did not exceed $102,000, so the upper stays at $102,000. The lower likewise stays at $98,000 because neither condition for replacing it is met.If the upper band was active and the current close is $102,500, the rule switches the displayed reference to the $98,000 lower band. If the close is $101,000 instead, the upper remains active.Calculating midpoint plus or minus three times ATR is only the first step. The previous bands, previous close and active side are necessary to reproduce the chart.
ATR period 10
ATR begins with a simple average of true ranges, then uses Wilder’s update weight of one-tenth at the default. A shorter period reacts more quickly to changing range sizes. The current candle’s true range can affect the candidate distance before a final close settles the reading.
Multiplier 3
This scales the ATR distance. A larger multiplier places the basic bands further from the midpoint and generally makes side changes less frequent. It does not multiply the probability of a continued move or prescribe a fixed percentage distance.
Initialization and timeframes
Maketo starts with the upper band at the first complete ATR value, requiring 11 candles at the default because the first true range needs a previous close. This declared starting rule affects early output. Switching candle interval changes the ranges, smoothing and band history together.
A wider candle changes more than direction
A large range can increase ATR and move the basic bands further apart. The final active line may retain an older level under the trailing rules. A line that barely changes therefore does not prove the current candle was quiet.
Repeated crossings can occur in an alternating market
Back-and-forth closes can repeatedly cross the active reference. Shorter periods and smaller multipliers can make this more common. Count the actual distance moved and examine the sequence rather than interpreting every side change as a major new phase.
Implementation details matter
Changing ATR from Wilder smoothing to an exponential average, changing the initial side, or using high-low crossings instead of closes changes the output. Matching only the numbers 10 and 3 is not enough for an exact comparison.
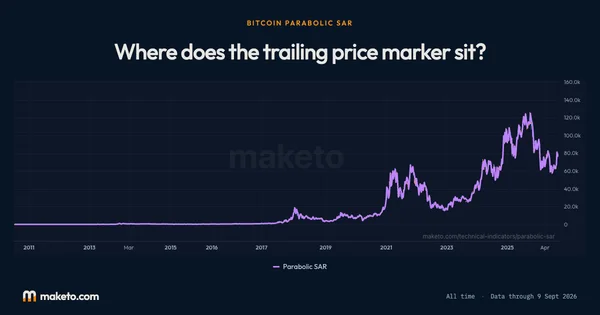
Supertrend compared with Parabolic SAR
SAR advances toward a tracked extreme using an acceleration factor. Supertrend uses range-scaled bands and closing-price crossing rules. Comparing their line positions shows how those two forms of trailing memory respond differently to long wicks, changing candle sizes and persistent movement. Open Bitcoin Parabolic SAR.
Does touching the band change Supertrend’s side?
The side-change test uses a strict closing-price crossing. A close equal to the active band retains that side, although the page’s direct price-versus-line label is Mixed at equality.
Is multiplier 3 the same as a 3% band?
No. It means three times ATR. The corresponding percentage of Bitcoin’s price changes as the average range and price level change.
The numbers
behind the chart
What does the current reading show?
Bitcoin price: the latest reading is $82,946, on . The highest reading since is $122,274 on ; the lowest is $0.0495 on .
Supertrend: the latest reading is $79,628, on . The highest reading since is $127,313 on ; the lowest is $0.0570 on .
Readings since Jul 17, 2010 let you compare Oct 20, 2026 with earlier months. Highest and lowest cover every reading shown; month-end values use the last reading on or before that date. Every figure here is the published daily reading at Supertrend, multiplier 3, period 10, beside Bitcoin's own close on the same day. Change the interval or the settings on the chart above and the chart is recalculated in your browser, but this record is not. How Maketo measures the Bitcoin price.
What are the latest, highest and lowest readings?
| Measure | Latest | Highest | Lowest |
|---|---|---|---|
| Bitcoin price | $82,946 | $122,274 | $0.0495 |
| Supertrend | $79,628 | $127,313 | $0.0570 |
How do the readings compare with earlier dates?
| Reference date | Bitcoin price | Supertrend |
|---|---|---|
| 1 month ago | $81,235 | $74,522 |
| 3 months ago | $64,989 | $65,704 |
| 6 months ago | $74,815 | $67,316 |
| 1 year ago | $107,197 | $119,657 |
| 2 years ago | $67,617 | $61,054 |
What was the reading at each month’s end?
| Reading date | Bitcoin price | Supertrend |
|---|---|---|
| $84,462 | $78,329 | |
| $77,842 | $72,311 | |
| $63,901 | $61,129 | |
| $60,164 | $66,338 | |
| $73,771 | $79,099 | |
| $76,327 | $71,654 | |
| $68,250 | $74,073 | |
| $67,627 | $76,289 | |
| $84,192 | $91,206 | |
| $87,568 | $95,070 | |
| $88,279 | $98,036 | |
| $111,658 | $119,657 | |
| $109,008 | $117,652 | |
| $111,780 | $120,807 | |
| $119,452 | $112,493 | |
| $107,077 | $110,248 | |
| $107,797 | $101,433 | |
| $94,264 | $86,391 | |
| $82,385 | $91,722 | |
| $84,330 | $94,035 | |
| $103,740 | $92,285 | |
| $92,710 | $104,603 | |
| $96,425 | $87,633 | |
| $70,262 | $65,835 |
Keep exploring



Source: Calculated by Maketo on one combined spot market, daily candles. Reading for .