

BITCOIN TRIX
Is the smoother price path picking up speed?
Mixed, at 0.0513%. As of Oct 20, 2026.
Bitcoin TRIX
Daily candles
1D candles. Last closed candle: 2026-10-20 00:00:00 UTC.
Drag to zoom, shift and drag to pan. Click the chart before scrolling to zoom with the wheel, and press Escape to let the page scroll again. The candle interval changes the calculation; the range buttons change only the dates on screen.
TRIX smooths the price three times before measuring change. This removes much of the short-term movement but also delays its response. Pick a candle interval and the chart recalculates.
Change the calculation
The last twelve readings as a table
| Candle start, UTC | TRIX |
|---|---|
| 2026-08-06 00:00:00 UTC | 0.026072% |
| 2026-08-13 00:00:00 UTC | 0.01667% |
| 2026-08-21 00:00:00 UTC | 0.108017% |
| 2026-08-28 00:00:00 UTC | 0.659296% |
| 2026-09-04 00:00:00 UTC | 0.753893% |
| 2026-09-12 00:00:00 UTC | 0.548177% |
| 2026-09-19 00:00:00 UTC | 0.298479% |
| 2026-09-27 00:00:00 UTC | 0.396653% |
| 2026-10-04 00:00:00 UTC | 0.37328% |
| 2026-10-12 00:00:00 UTC | 0.231875% |
| 2026-10-19 00:00:00 UTC | 0.066136% |
| 2026-10-20 00:00:00 UTC | 0.051277% |
Quote this chart
The image is of the chart as you have it. The link is to the page, which opens on the published reading, so the sentence above is what tells a reader which interval and formula the quotation was taken on.
Maketo. Bitcoin TRIX (trix; period 15, signal 9), 1D candles, Maketo combined market. Last closed candle: 2026-10-20 00:00:00 UTC. Calculation version 1.0.0. https://maketo.com/technical-indicators/trix
Source: <a href="https://maketo.com/technical-indicators/trix">Maketo Bitcoin TRIX</a>
RIGHT NOW
Mixed, at 0.0513%. As of Oct 20, 2026.
What the day shows
At the 2026-10-20 UTC close, the reading was 0.0512771. The previous available reading was 0.0661362. This measures change in a price average smoothed three times to soften brief jumps. The selected period is 15 daily candles.
How to read that number
A positive reading means the smooth path is rising; a negative reading means it is falling. The signal line helps show whether that pace is changing.
What it was read at
TRIX, period 15, signal 9, on daily candles. Change the interval or the settings on the chart above and every number there is recalculated in your browser. This sentence keeps the daily reading the page is published on.
Understanding
Bitcoin TRIX
Where it stands today
TRIX: mixed, at 0.0513% as of .
What is Bitcoin TRIX?
Bitcoin TRIX measures the one-candle percentage change in a price line that has been smoothed three times. The default applies a 15-period exponential moving average to closes, another 15-period average to that first line, and a third to the second. It then measures how much the final line changed from the previous candle.This separates TRIX from an ordinary percentage return. It follows changes in a heavily smoothed path, so brief moves in the raw close have a reduced and delayed effect. The displayed signal line adds a 9-period exponential average of TRIX itself. That makes it possible to compare the current smoothed rate with its recent average.
The sign describes the triple-smoothed line
Positive TRIX means that final smoothed price line rose from its previous value. Negative TRIX means it fell. A reading of +0.2% does not say the latest Bitcoin candle gained 0.2%; it describes the change after three smoothing stages.
Compare the rate with its own average
TRIX above the signal line is higher than its recent smoothed rate. It may still be negative, meaning the triple-smoothed price continues to fall but at a rate above its recent average. Positive TRIX below its signal describes a rising smoothed path whose rate is below that recent average.
Read agreement and disagreement explicitly
Maketo labels TRIX Rising when it is above zero and above its signal, Falling when it is below both, and Mixed otherwise. This distinguishes the sign of the smoothed change from whether that change is stronger or weaker than its recent pattern.
How TRIX is calculated
Apply a 15-candle exponential average three times in succession. TRIX is the percentage change in the resulting series from one candle to the next; the signal defaults to 9 candles. The page is published on TRIX, period 15, signal 9. A period counts candles at the interval you choose, so the same setting covers a different stretch of time on a one-hour chart than on a daily one. How smoothing and missing candles are handled.
A calculation you can follow
Use these invented, already initialized values to isolate the final two calculation steps. Suppose the triple-smoothed price was $100,000 on the previous candle and is $100,200 on the latest completed candle.TRIX = 100 × ($100,200 ÷ $100,000 − 1) = +0.20%.If the previous 9-period signal was +0.10%, its update weight is 0.2. The new signal is 0.10% + 0.2 × (0.20% − 0.10%) = +0.12%.TRIX is positive and above its signal. If a later TRIX value is +0.05% while its signal remains +0.10%, the smoothed price is still rising but the two summary comparisons disagree.The calculation distinguishes a rising path from a rising rate of change. Neither the triple-smoothed price nor its change is the latest raw Bitcoin close.
Period 15
The same period is applied at all three price-smoothing stages. Each exponential average uses a weight of 2 ÷ (period + 1) for its new input. Increasing the period therefore changes the response three times, rather than merely extending one rolling window.
Signal period 9
This controls the average of the completed TRIX values, not the three underlying price averages. A shorter signal follows TRIX more closely and can change sides more often. The TRIX line itself is unchanged when only the signal period changes.
Warmup and candle interval
Maketo seeds each stage with its first full simple average. With period 15, the first triple-smoothed price needs 43 candles, TRIX needs 44, and the default signal needs 52. These are minimums, not a claim that the calculation forgets everything earlier. On annual candles, available Bitcoin history may be too short.
Smooth does not mean early
Filtering short moves comes with slower response. TRIX can remain positive for a time after raw prices begin falling, because earlier values still influence three successive averages. That is a property of the formula rather than a delayed data feed.
TRIX and TEMA are different
The triple exponential moving average called TEMA combines three EMA stages into a price line designed to alter lag. TRIX instead takes the percentage change of the third EMA stage alone. The shared use of three averages does not make their outputs equivalent.
Near-zero crossings can overstate small changes
A line repeatedly moving just above and below zero may reflect tiny changes in a nearly level smoothed path. Check the values and their candle interval rather than treating each crossing as a large change in Bitcoin’s behavior.
TRIX compared with Rate of Change
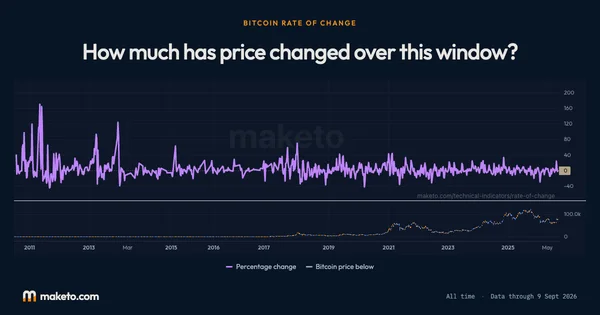
Rate of Change exposes the raw difference between two closes. TRIX exposes the one-step change after three rounds of smoothing. Comparing them helps show how much of a recent price move remains once brief fluctuations have been reduced. Open Bitcoin Rate of Change.
Why is TRIX usually much smaller than Bitcoin’s daily return?
It measures change in a smoothed price line. Three averaging stages reduce the immediate effect of a sudden raw-price movement, so the two percentages describe different inputs.
Why does the signal line begin later than TRIX?
The signal requires its own full window of valid TRIX observations. The default needs nine of them before its first value can be initialized.
The numbers
behind the chart
What does the current reading show?
Bitcoin price: the latest reading is $82,946, on . The highest reading since is $123,501 on ; the lowest is $0.0495 on .
TRIX: the latest reading is 0.0513%, on . The highest reading since is 6.86% on ; the lowest is −2.14% on .
Smoothed line: the latest reading is 0.1331%, on . The highest reading since is 6.10% on ; the lowest is −1.95% on .
Readings since Jul 17, 2010 let you compare Oct 20, 2026 with earlier months. Highest and lowest cover every reading shown; month-end values use the last reading on or before that date. Every figure here is the published daily reading at TRIX, period 15, signal 9, beside Bitcoin's own close on the same day. Change the interval or the settings on the chart above and the chart is recalculated in your browser, but this record is not. How Maketo measures the Bitcoin price.
What are the latest, highest and lowest readings?
| Measure | Latest | Highest | Lowest |
|---|---|---|---|
| Bitcoin price | $82,946 | $123,501 | $0.0495 |
| TRIX | 0.0513% | 6.86% | −2.14% |
| Smoothed line | 0.1331% | 6.10% | −1.95% |
How do the readings compare with earlier dates?
| Reference date | Bitcoin price | TRIX | Smoothed line |
|---|---|---|---|
| 1 month ago | $81,235 | 0.2985% | 0.4188% |
| 3 months ago | $64,989 | −0.1225% | −0.2412% |
| 6 months ago | $75,159 | 0.1520% | 0.0481% |
| 1 year ago | $110,556 | −0.0939% | 0.0283% |
| 2 years ago | $66,077 | 0.1019% | 0.1463% |
What was the reading at each month’s end?
| Reading date | Bitcoin price | TRIX | Smoothed line |
|---|---|---|---|
| $84,462 | 0.3967% | 0.3726% | |
| $77,842 | 0.6593% | 0.4057% | |
| $63,901 | 0.0973% | 0.0724% | |
| $58,532 | −0.5121% | −0.5294% | |
| $73,575 | −0.1123% | −0.0049% | |
| $77,449 | 0.3524% | 0.2591% | |
| $71,318 | 0.0605% | 0.0118% | |
| $64,643 | −0.8555% | −0.8762% | |
| $86,617 | 0.0747% | 0.1239% | |
| $87,329 | −0.2178% | −0.2464% | |
| $90,480 | −0.7331% | −0.6188% | |
| $114,104 | −0.1861% | −0.1390% | |
| $112,185 | −0.0079% | 0.0189% | |
| $108,378 | −0.1026% | −0.0310% | |
| $117,835 | 0.3141% | 0.3457% | |
| $105,388 | 0.0061% | 0.0761% | |
| $107,781 | 0.6001% | 0.5957% | |
| $94,674 | 0.1693% | 0.0126% | |
| $86,920 | −0.2903% | −0.3839% | |
| $91,544 | −0.1472% | −0.1260% | |
| $102,589 | 0.2345% | 0.1426% | |
| $94,235 | 0.1956% | 0.3464% | |
| $95,907 | 1.17% | 1.14% | |
| $69,943 | 0.3294% | 0.3011% |
Keep exploring



Source: Calculated by Maketo on one combined spot market, daily candles. Reading for .