

BITCOIN TRUE STRENGTH INDEX
Are recent price changes pushing in one direction?
Mixed, at 0.6136. As of Oct 20, 2026.
Bitcoin True Strength Index
Daily candles
1D candles. Last closed candle: 2026-10-20 00:00:00 UTC.
Drag to zoom, shift and drag to pan. Click the chart before scrolling to zoom with the wheel, and press Escape to let the page scroll again. The candle interval changes the calculation; the range buttons change only the dates on screen.
TSI compares smoothed price changes with smoothed absolute changes. This describes how consistently those changes point in the same direction. Pick a candle interval and the chart recalculates.
Change the calculation
The last twelve readings as a table
| Candle start, UTC | True strength index |
|---|---|
| 2026-08-05 00:00:00 UTC | -0.277883 |
| 2026-08-13 00:00:00 UTC | -1.313 |
| 2026-08-20 00:00:00 UTC | 20.905 |
| 2026-08-28 00:00:00 UTC | 53.082 |
| 2026-09-04 00:00:00 UTC | 42.18 |
| 2026-09-12 00:00:00 UTC | 23.782 |
| 2026-09-19 00:00:00 UTC | 16.835 |
| 2026-09-27 00:00:00 UTC | 29.005 |
| 2026-10-04 00:00:00 UTC | 28.289 |
| 2026-10-12 00:00:00 UTC | 10.482 |
| 2026-10-19 00:00:00 UTC | -0.049172 |
| 2026-10-20 00:00:00 UTC | 0.613607 |
Quote this chart
The image is of the chart as you have it. The link is to the page, which opens on the published reading, so the sentence above is what tells a reader which interval and formula the quotation was taken on.
Maketo. Bitcoin True Strength Index (tsi; long 25, short 13, signal 13), 1D candles, Maketo combined market. Last closed candle: 2026-10-20 00:00:00 UTC. Calculation version 1.0.0. https://maketo.com/technical-indicators/true-strength-index
Source: <a href="https://maketo.com/technical-indicators/true-strength-index">Maketo Bitcoin True Strength Index</a>
RIGHT NOW
Mixed, at 0.6136. As of Oct 20, 2026.
What the day shows
At the 2026-10-20 UTC close, the reading was 0.613607. The previous available reading was -0.0491715. This compares smoothed daily price changes with the size of those changes.
How to read that number
Above zero means upward changes dominate after smoothing. A rise toward zero from below describes easing downward pressure, not necessarily rising prices.
What it was read at
True strength index, long 25, short 13, signal 13, on daily candles. Change the interval or the settings on the chart above and every number there is recalculated in your browser. This sentence keeps the daily reading the page is published on.
Understanding
Bitcoin True Strength Index
Where it stands today
True Strength Index: mixed, at 0.6136 as of .
What is Bitcoin True Strength Index?
Bitcoin’s True Strength Index, or TSI, compares smoothed signed price changes with smoothed changes measured without their signs. Signed changes allow rises and falls to offset one another. Absolute changes count both as movement. The ratio therefore describes how consistently the recent movement has pointed in one direction.The default smooths each series first over 25 periods and then over 13, using exponential averages. It divides the twice-smoothed signed changes by the twice-smoothed absolute changes and multiplies by 100. A separate 13-period signal line averages TSI. The scale runs from −100 to +100, but it is not a price return or a probability.
Compare net movement with total movement
If similarly sized upward and downward changes offset each other, the signed average can sit near zero while the absolute average stays positive. TSI then sits near zero despite active price movement. If nearly all changes point upward, the signed and absolute averages become similar and TSI approaches +100.
Separate positive from improving
A negative TSI moving upward still means smoothed losses outweigh gains. The imbalance is becoming less negative. A positive TSI moving down can still reflect gains outweighing losses. The sign, the recent direction of the line, and its position against the signal answer different questions.
Read the page’s combined comparison
Maketo labels TSI Rising when it is positive and above its signal, Falling when it is negative and below its signal, and Mixed when those comparisons disagree or touch. This is a description of the chosen calculation, not proof that a price move will continue.
How True Strength Index is calculated
Smooth close-to-close changes with 25- and 13-period exponential averages. Apply the same smoothing to absolute changes. TSI = 100 × smoothed change / smoothed absolute change. The page is published on True strength index, long 25, short 13, signal 13. A period counts candles at the interval you choose, so the same setting covers a different stretch of time on a one-hour chart than on a daily one. How smoothing and missing candles are handled.
A calculation you can follow
These invented smoothed values make the ratio and signal update easy to follow. Suppose the twice-smoothed signed price change is +$300, while the identically smoothed absolute price change is $500.TSI = 100 × $300 ÷ $500 = +60. The signed component is 60% of the absolute component; Bitcoin did not necessarily gain 60%.For the default 13-period signal, the new-input weight is 2 ÷ 14, or one-seventh. If its prior value was 46, the new signal is 46 + (60 − 46) ÷ 7 = 48.If both smoothed components instead doubled to +$600 and $1,000, TSI would remain +60. The underlying dollar movements would be larger, but their directional balance would be unchanged.TSI separates directional balance from dollar scale. It can stay unchanged while Bitcoin’s candle movements become much larger.
The 25/13 smoothing pair
The longer average smooths the original changes; the shorter average smooths that first result. The same sequence must be applied to signed and absolute changes. Changing only one side would alter the meaning of the ratio rather than simply adjust its responsiveness.
The 13-period signal
This final average controls the comparison with TSI’s own recent level. It does not enter the numerator or denominator. A different signal length can change the direction label while leaving the displayed TSI number unchanged.
Required history
The default first TSI needs 38 consecutive closes because changes start after the first close and both averaging stages need initialization. The signal begins after 50 closes. More history continues to influence the exponential averages, so changing the visible chart range does not reset the calculation.
A high reading does not measure movement size
A sequence of small, mostly upward changes can produce a high TSI. Large alternating changes can produce a value near zero. Compare the candle sizes or a range measure when the question is how much Bitcoin is moving rather than how consistently it moves in one direction.
Double smoothing retains earlier conditions
One strong contrary candle may only gradually affect both the signed and absolute averages. A high value can persist after the latest close changes direction. That persistence follows from the smoothing, not from information about future demand.
A zero denominator needs an explicit convention
When the smoothed absolute change is zero, the available sequence contains no measured movement. Maketo returns zero. Missing prices are not treated as flat changes; gaps interrupt the averaging stages and require new valid history.
True Strength Index compared with RSI
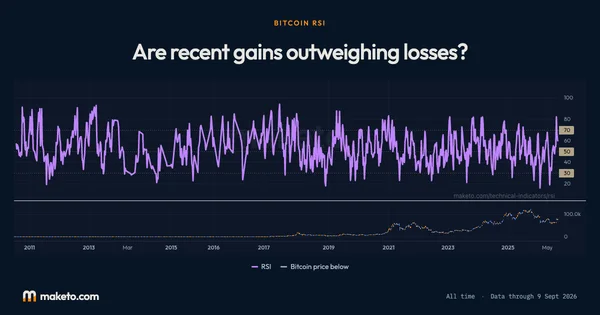
RSI smooths gains and losses separately and displays their balance on a 0–100 scale. TSI twice smooths signed and absolute changes and centers its scale on zero. Compare the timing and persistence of their changes rather than comparing their raw numbers as if 60 meant the same thing. Open Bitcoin RSI.
Does TSI of 60 mean 60% of candles rose?
No. The calculation uses smoothed price-change sizes, not a count of rising candles. A few large changes can outweigh many smaller ones.
Can TSI be near zero during large price swings?
Yes. Large gains and losses can cancel in the signed numerator while both remain in the absolute denominator. That is an active but directionally balanced sequence.
The numbers
behind the chart
What does the current reading show?
Bitcoin price: the latest reading is $82,946, on . The highest reading since is $122,274 on ; the lowest is $0.0495 on .
True strength index: the latest reading is 0.6136, on . The highest reading since is 84.33 on ; the lowest is −64.42 on .
Smoothed line: the latest reading is 7.55, on . The highest reading since is 76.11 on ; the lowest is −55.53 on .
Readings since Jul 17, 2010 let you compare Oct 20, 2026 with earlier months. Highest and lowest cover every reading shown; month-end values use the last reading on or before that date. Every figure here is the published daily reading at True strength index, long 25, short 13, signal 13, beside Bitcoin's own close on the same day. Change the interval or the settings on the chart above and the chart is recalculated in your browser, but this record is not. How Maketo measures the Bitcoin price.
What are the latest, highest and lowest readings?
| Measure | Latest | Highest | Lowest |
|---|---|---|---|
| Bitcoin price | $82,946 | $122,274 | $0.0495 |
| True strength index | 0.6136 | 84.33 | −64.42 |
| Smoothed line | 7.55 | 76.11 | −55.53 |
How do the readings compare with earlier dates?
| Reference date | Bitcoin price | True strength index | Smoothed line |
|---|---|---|---|
| 1 month ago | $81,235 | 16.83 | 22.27 |
| 3 months ago | $64,989 | −1.38 | −11.31 |
| 6 months ago | $74,815 | 14.46 | 4.72 |
| 1 year ago | $107,197 | −13.04 | 1.50 |
| 2 years ago | $68,427 | 21.76 | 11.75 |
What was the reading at each month’s end?
| Reading date | Bitcoin price | True strength index | Smoothed line |
|---|---|---|---|
| $84,462 | 29.00 | 25.95 | |
| $77,842 | 53.08 | 36.28 | |
| $63,901 | 3.51 | 4.10 | |
| $60,164 | −32.05 | −31.11 | |
| $73,771 | −15.63 | −3.07 | |
| $76,327 | 19.19 | 20.01 | |
| $70,545 | 0.7133 | −0.3638 | |
| $67,627 | −30.69 | −33.01 | |
| $78,693 | −22.44 | −6.00 | |
| $87,199 | −13.76 | −14.72 | |
| $87,345 | −40.19 | −33.64 | |
| $114,553 | −9.20 | −8.79 | |
| $109,670 | −6.27 | 1.90 | |
| $111,258 | −10.29 | −1.64 | |
| $118,066 | 26.85 | 29.43 | |
| $107,325 | 4.01 | 2.56 | |
| $104,017 | 25.81 | 35.56 | |
| $94,177 | 26.93 | 15.85 | |
| $82,544 | −8.60 | −9.35 | |
| $96,562 | −8.99 | −7.89 | |
| $104,733 | 14.11 | 12.50 | |
| $93,479 | −5.41 | 6.34 | |
| $97,954 | 56.15 | 50.32 | |
| $66,638 | 22.61 | 20.29 |
Keep exploring



Source: Calculated by Maketo on one combined spot market, daily candles. Reading for .