

BITCOIN VWAP
What average price did this trading actually happen at?
Falling, at $83,241. As of Oct 20, 2026.
Bitcoin VWAP
Daily candles
1D candles. Last closed candle: 2026-10-20 00:00:00 UTC.
Drag to zoom, shift and drag to pan. Click the chart before scrolling to zoom with the wheel, and press Escape to let the page scroll again. The candle interval changes the calculation; the range buttons change only the dates on screen.
VWAP gives busier candles more weight. The default uses typical candle price weighted by Bitcoin volume. Separately named trade-weighted variants divide actual quote value by actual Bitcoin traded. Pick a candle interval and the chart recalculates.
Change the calculation
The last twelve readings as a table
| Candle start, UTC | Volume-weighted price |
|---|---|
| 2026-08-06 00:00:00 UTC | $64,442.53 |
| 2026-08-14 00:00:00 UTC | $63,934.66 |
| 2026-08-21 00:00:00 UTC | $67,394.43 |
| 2026-08-28 00:00:00 UTC | $72,440.39 |
| 2026-09-05 00:00:00 UTC | $75,939.01 |
| 2026-09-12 00:00:00 UTC | $78,709.9 |
| 2026-09-19 00:00:00 UTC | $78,287.66 |
| 2026-09-27 00:00:00 UTC | $80,686.09 |
| 2026-10-04 00:00:00 UTC | $82,719.96 |
| 2026-10-12 00:00:00 UTC | $84,107.99 |
| 2026-10-19 00:00:00 UTC | $83,332.47 |
| 2026-10-20 00:00:00 UTC | $83,240.99 |
Quote this chart
The image is of the chart as you have it. The link is to the page, which opens on the published reading, so the sentence above is what tells a reader which interval and formula the quotation was taken on.
Maketo. Bitcoin VWAP (rolling; period 20), 1D candles, Maketo combined market. Last closed candle: 2026-10-20 00:00:00 UTC. Calculation version 1.0.0. https://maketo.com/technical-indicators/vwap
Source: <a href="https://maketo.com/technical-indicators/vwap">Maketo Bitcoin VWAP</a>
RIGHT NOW
Falling, at $83,241. As of Oct 20, 2026.
What the day shows
At the 2026-10-20 UTC close, the reading was 83,241. The previous available reading was 83,332.5. This estimate weights each day’s high-low-close average by traded Bitcoin. It uses daily candles. The selected period is 20 daily candles.
How to read that number
Price above VWAP is above the measured average traded price for that particular window. Changing the reset or anchor changes the question.
What it was read at
Candle-based rolling VWAP, period 20, on daily candles. Change the interval or the settings on the chart above and every number there is recalculated in your browser. This sentence keeps the daily reading the page is published on.
Understanding
Bitcoin VWAP
Where it stands today
VWAP: falling, at $83,241 as of .
What is Bitcoin VWAP?
VWAP is a volume-weighted average price: prices attached to more trading receive more influence. The key question is which prices and which span of time are being averaged. A rolling average of recent candles, a daily reset, and an average starting at a chosen event can all produce valid but different answers.Maketo’s default uses typical candle price, defined as (high + low + close) ÷ 3. It multiplies each typical price by that candle’s BTC volume, sums the products over 20 candles, and divides by total BTC volume. The result is a dollar price. This is a candle-based approximation because every trade inside a candle receives the same representative price.The trade-weighted variants use actual recorded dollar trade value divided by BTC volume over the same covered period. They require qualified trade-value data. Candle prices multiplied by volume cannot fill that requirement. The distinction matters most when substantial trading occurred far from a candle’s typical price, or when large candles contain uneven activity.
Read price against the selected average
Above VWAP means the close is above the volume-weighted reference for the selected window or anchor. Below means it is below. Maketo’s directional label uses that comparison; it does not require the average itself to slope the same way. The reference is not a claim about every participant’s purchase price.
Check whether old volume remains in the calculation
A rolling average drops the oldest candle when a new one arrives. A calendar or chosen-anchor average keeps adding observations until its reset or the end of available history. As an anchored total grows, a small new candle may have little influence, even after a noticeable price move.
Compare like coverage
Two VWAP values are meaningfully comparable only when their market basis, interval, price method, and start and end points match. Changing from typical candle prices to actual trade values changes the calculation, not merely its display precision.
How VWAP is calculated
Candle-based VWAP sums ((high + low + close) / 3) × volume and divides by summed volume. Trade-weighted variants use actual quote volume in the numerator. Rolling defaults to 20 candles; other views use explicit UTC resets or anchors. The page is published on Candle-based rolling VWAP, period 20. A period counts candles at the interval you choose, so the same setting covers a different stretch of time on a one-hour chart than on a daily one. How smoothing and missing candles are handled.
A calculation you can follow
This illustrative two-candle example shows both the weighting and the limitation of representative candle prices. The first candle has typical price $100,000 and volume 10 BTC. Its weighted amount is $1,000,000.The second has typical price $110,000 and volume 30 BTC. Its weighted amount is $3,300,000.The candle-based average is $4,300,000 ÷ 40 BTC = $107,500. The simple average of the two typical prices would be $105,000, because it ignores the heavier activity in the second candle.If the actual recorded trade values were instead $1,020,000 and $3,240,000, the trade-weighted average would be $4,260,000 ÷ 40 = $106,500. The same OHLC candles and BTC totals do not determine that exact trade-value sum.Weighting answers which observed prices had more activity behind them. The precision of the answer still depends on whether those prices represent whole candles or actual recorded trades.
Rolling period
The default includes the current candle and the preceding 19. A period of 20 means 20 candles of the selected interval, not always 20 days. A window with zero total recorded volume has no weighted price and is left unavailable.
Calendar resets
Session means a UTC day starting at midnight. Weekly begins Monday at 00:00 UTC; monthly begins on the first day at 00:00 UTC. These boundaries do not follow a particular stock exchange’s opening hours. The calculation requires coverage from the actual boundary rather than silently beginning later.
Chosen anchor and candle boundaries
An anchored average starts at the selected available candle’s opening time and accumulates from there. A candle that crosses a calendar reset cannot be split accurately from its OHLC summary, so that calendar calculation is unavailable. Coarse intervals therefore do not work with every reset. Required missing inputs also prevent an uninterrupted anchored value.
VWAP is not everyone’s cost basis
Coins may trade repeatedly, and the recorded market does not include every Bitcoin transaction. The average describes covered trading during the selected span. It does not establish the average price paid by all current holders.
Changing interval can change the approximation
Typical price from one large candle need not match the volume-weighted typical prices of its smaller parts. Exact trade-value totals can be combined consistently over matching complete boundaries; the candle approximation does not generally have that property.
VWAP compared with Weighted Moving Average
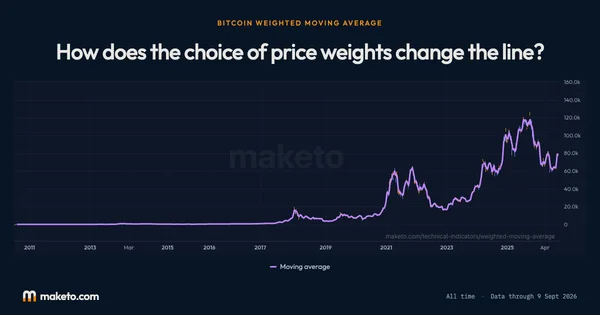
The VWMA variant weights closing prices by volume over a rolling window. Maketo’s default VWAP weights typical prices, while its trade-weighted variants use actual dollar trade values. These are three different price inputs even when the volume and period are identical. Open Bitcoin Weighted Moving Average.
Why is a session value missing when price candles are available?
Price candles alone may not cover the whole UTC session from its start, may cross the reset boundary, or may lack required volume. Trade-weighted modes additionally need actual qualified trade-value totals. An available price chart does not prove those requirements are met.
Can I compare averages with different anchors?
You can inspect them as separate references, but each describes a different collection of trading. State the anchor with the value. A difference between them is not automatically a change in the current market.
The numbers
behind the chart
What does the current reading show?
Bitcoin price: the latest reading is $82,946, on . The highest reading since is $123,325 on ; the lowest is $0.0495 on .
Volume-weighted price: the latest reading is $83,241, on . The highest reading since is $117,794 on ; the lowest is $2.45 on .
Readings since Jul 17, 2010 let you compare Oct 20, 2026 with earlier months. Highest and lowest cover every reading shown; month-end values use the last reading on or before that date. Every figure here is the published daily reading at Candle-based rolling VWAP, period 20, beside Bitcoin's own close on the same day. Change the interval or the settings on the chart above and the chart is recalculated in your browser, but this record is not. How Maketo measures the Bitcoin price.
What are the latest, highest and lowest readings?
| Measure | Latest | Highest | Lowest |
|---|---|---|---|
| Bitcoin price | $82,946 | $123,325 | $0.0495 |
| Volume-weighted price | $83,241 | $117,794 | $2.45 |
How do the readings compare with earlier dates?
| Reference date | Bitcoin price | Volume-weighted price |
|---|---|---|
| 1 month ago | $81,235 | $78,288 |
| 3 months ago | $64,717 | $61,879 |
| 6 months ago | $75,718 | $71,446 |
| 1 year ago | $110,784 | $116,350 |
| 2 years ago | $68,427 | $63,661 |
What was the reading at each month’s end?
| Reading date | Bitcoin price | Volume-weighted price |
|---|---|---|
| $84,462 | $80,686 | |
| $77,842 | $72,440 | |
| $64,723 | $64,439 | |
| $58,532 | $62,299 | |
| $76,980 | $79,162 | |
| $77,632 | $74,214 | |
| $68,800 | $70,533 | |
| $67,991 | $67,735 | |
| $88,299 | $91,831 | |
| $87,914 | $88,852 | |
| $90,897 | $92,592 | |
| $108,310 | $110,650 | |
| $114,057 | $113,935 | |
| $113,484 | $116,921 | |
| $117,941 | $117,107 | |
| $106,983 | $105,495 | |
| $107,797 | $106,247 | |
| $95,028 | $86,669 | |
| $82,385 | $84,175 | |
| $84,330 | $91,221 | |
| $104,733 | $101,883 | |
| $93,479 | $98,761 | |
| $97,954 | $86,784 | |
| $67,053 | $65,588 |
Keep exploring


Source: Calculated by Maketo on one combined spot market, daily candles. Reading for .