

BITCOIN WEIGHTED MOVING AVERAGE
How does the choice of price weights change the line?
Mixed, at $82,564. As of Oct 20, 2026.
Bitcoin Weighted Moving Average
Daily candles
1D candles. Last closed candle: 2026-10-20 00:00:00 UTC.
Drag to zoom, shift and drag to pan. Click the chart before scrolling to zoom with the wheel, and press Escape to let the page scroll again. The candle interval changes the calculation; the range buttons change only the dates on screen.
Weighted moving averages change how much each candle contributes. Standard WMA emphasizes recency; VWMA emphasizes trading volume; Hull combines weighted averages to respond faster. Pick a candle interval and the chart recalculates.
Change the calculation
The last twelve readings as a table
| Candle start, UTC | Moving average |
|---|---|
| 2026-08-06 00:00:00 UTC | $64,082.05 |
| 2026-08-14 00:00:00 UTC | $63,884.4 |
| 2026-08-21 00:00:00 UTC | $66,526.38 |
| 2026-08-28 00:00:00 UTC | $73,847.45 |
| 2026-09-05 00:00:00 UTC | $78,318.66 |
| 2026-09-12 00:00:00 UTC | $78,428.65 |
| 2026-09-19 00:00:00 UTC | $78,155.03 |
| 2026-09-27 00:00:00 UTC | $82,087.59 |
| 2026-10-04 00:00:00 UTC | $84,157.18 |
| 2026-10-12 00:00:00 UTC | $83,757.35 |
| 2026-10-19 00:00:00 UTC | $82,592.52 |
| 2026-10-20 00:00:00 UTC | $82,563.99 |
Quote this chart
The image is of the chart as you have it. The link is to the page, which opens on the published reading, so the sentence above is what tells a reader which interval and formula the quotation was taken on.
Maketo. Bitcoin Weighted Moving Average (wma; period 20), 1D candles, Maketo combined market. Last closed candle: 2026-10-20 00:00:00 UTC. Calculation version 1.0.0. https://maketo.com/technical-indicators/weighted-moving-average
Source: <a href="https://maketo.com/technical-indicators/weighted-moving-average">Maketo Bitcoin Weighted Moving Average</a>
RIGHT NOW
Mixed, at $82,564. As of Oct 20, 2026.
What the day shows
At the 2026-10-20 UTC close, the reading was 82,564. The previous available reading was 82,592.5. This price average gives the newest daily close the largest weight. The selected period is 20 daily candles.
How to read that number
A price with heavier weight pulls the line closer. The volume-weighted variant can diverge when busy candles close far from quieter ones.
What it was read at
Weighted moving average, period 20, on daily candles. Change the interval or the settings on the chart above and every number there is recalculated in your browser. This sentence keeps the daily reading the page is published on.
Understanding
Bitcoin Weighted Moving Average
Where it stands today
Weighted Moving Average: mixed, at $82,564 as of .
What is Bitcoin Weighted Moving Average?
A weighted moving average asks which observations should count most in an average price. This page brings together three answers. A linear weighted average gives newer closes more weight. Hull’s average combines weighted averages to respond more quickly. A volume-weighted moving average gives more weight to candles in which more Bitcoin traded.The linear and volume-weighted methods multiply each price by its weight, add the products, then divide by total weight. Their result is a dollar price between the lowest and highest included closes. Hull’s method also subtracts one average from another, so it can move outside that range. That difference comes from the formula.
Check what supplies the weight
In a 20-candle linear weighted average, the oldest close receives weight 1 and the newest receives weight 20. Total weight is 210, so the latest close supplies about 9.52% of the result. In the volume-weighted view, a quiet recent candle can count less than a busy older candle.
Separate position from slope
Price above an average says it is higher than the weighted reference. A rising line says that reference is moving up. Maketo requires both price above the line and the line above its value five candles earlier for a Rising reading. Opposing observations produce Mixed, which can happen when price changes direction before the reference follows.
Understand Hull’s quicker turns
Hull’s calculation doubles the shorter weighted average, subtracts the longer one, then smooths the result. The subtraction reduces delay but can exaggerate a turn. A quickly bending line contains no future prices. Its visual smoothness is not proof that the next price move will follow it.
How Weighted Moving Average is calculated
WMA assigns ascending weights from 1 to the period. VWMA divides the sum of close × base volume by summed base volume. Hull combines half-length and full-length WMAs and smooths over the square-root length. The page is published on Weighted moving average, period 20. A period counts candles at the interval you choose, so the same setting covers a different stretch of time on a one-hour chart than on a daily one. How smoothing and missing candles are handled.
A calculation you can follow
Consider three illustrative closes of $90,000, $100,000 and $110,000, with volumes of 10, 20 and 70 BTC respectively. The simple average is $100,000: each close has the same weight.The linear weighted average is ($90,000 × 1 + $100,000 × 2 + $110,000 × 3) / 6 = $103,333.33.The volume-weighted average is ($90,000 × 10 + $100,000 × 20 + $110,000 × 70) / 100 = $106,000.If the 70 BTC instead belonged to the first candle and the last had 10 BTC, the volume-weighted result would be $94,000. The linear weighted result would remain $103,333.33.The closing prices did not change in the last comparison. Only which candles had the most trading changed, so only the volume-weighted average moved.
Period
The default is 20 selected candles. On a 5-minute chart that describes 100 minutes; on a daily chart it describes 20 days. Changing the visible range changes the display. Changing candle interval changes the actual observations.
Hull rounding
For period 20, Maketo uses a 10-candle shorter average, a 20-candle longer average, and a final four-candle weighted average. Half-period and square-root lengths are rounded down, with a minimum of one. Other rounding conventions produce different curves.
Volume weighting
This variant uses candle closes multiplied by BTC volume. A candle with zero volume adds no weight. A window with zero total volume has no usable average, and missing volume is not treated as zero activity.
Faster is not necessarily more dependable
A more responsive line follows both lasting moves and brief reversals sooner. Compare methods with matching periods, candle intervals and price sources. Choosing whichever line best matches the last turn says little about the next one.
A weighted close is not an execution price
All of a candle’s trading volume is attached to its close in this variant. It does not reproduce the average price of the trades inside that candle. Wider candles leave more room for the two prices to differ.
Weighted Moving Average compared with VWAP
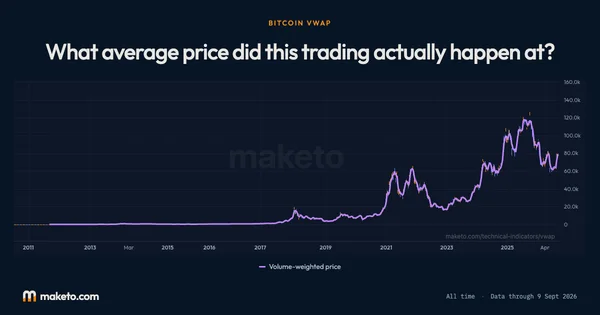
The default candle-based VWAP uses each candle’s high-low-close average rather than its close. Calendar and anchored views choose the history differently, too. Trade-weighted VWAP uses actual traded dollar amounts when those inputs qualify. Open Bitcoin VWAP.
Can Hull’s average exceed every recent close?
Yes. Its subtraction step can create a value outside the range of the closes. A linear or volume-weighted average with nonnegative weights cannot do that within its own window.
Why does Hull need more candles?
It first needs enough closes for the longer average, then enough results for the final smoothing. With period 20 and final length four, the numerical line first becomes available after 23 consecutive closes.
Does every weighted average use volume?
No. Linear weighting uses candle order and Hull combines those averages. Only the volume-weighted variant uses the amount of BTC traded as its weighting input.
The numbers
behind the chart
What does the current reading show?
Bitcoin price: the latest reading is $82,946, on . The highest reading since is $123,325 on ; the lowest is $0.0495 on .
Moving average: the latest reading is $82,564, on . The highest reading since is $118,566 on ; the lowest is $0.0617 on .
Readings since Jul 17, 2010 let you compare Oct 20, 2026 with earlier months. Highest and lowest cover every reading shown; month-end values use the last reading on or before that date. Every figure here is the published daily reading at Weighted moving average, period 20, beside Bitcoin's own close on the same day. Change the interval or the settings on the chart above and the chart is recalculated in your browser, but this record is not. How Maketo measures the Bitcoin price.
What are the latest, highest and lowest readings?
| Measure | Latest | Highest | Lowest |
|---|---|---|---|
| Bitcoin price | $82,946 | $123,325 | $0.0495 |
| Moving average | $82,564 | $118,566 | $0.0617 |
How do the readings compare with earlier dates?
| Reference date | Bitcoin price | Moving average |
|---|---|---|
| 1 month ago | $81,235 | $78,155 |
| 3 months ago | $64,717 | $63,141 |
| 6 months ago | $75,718 | $72,944 |
| 1 year ago | $110,784 | $116,935 |
| 2 years ago | $68,427 | $64,317 |
What was the reading at each month’s end?
| Reading date | Bitcoin price | Moving average |
|---|---|---|
| $84,462 | $82,088 | |
| $77,842 | $73,847 | |
| $64,723 | $64,586 | |
| $58,532 | $61,576 | |
| $76,980 | $78,078 | |
| $77,632 | $75,779 | |
| $68,800 | $70,565 | |
| $67,991 | $67,355 | |
| $88,299 | $90,912 | |
| $87,914 | $87,867 | |
| $90,897 | $90,471 | |
| $108,310 | $110,632 | |
| $114,057 | $113,211 | |
| $113,484 | $116,201 | |
| $117,941 | $118,006 | |
| $106,983 | $105,316 | |
| $107,797 | $107,346 | |
| $95,028 | $90,168 | |
| $82,385 | $84,843 | |
| $84,330 | $92,285 | |
| $104,733 | $102,963 | |
| $93,479 | $96,489 | |
| $97,954 | $92,001 | |
| $67,053 | $66,778 |
Keep exploring


Source: Calculated by Maketo on one combined spot market, daily candles. Reading for .