

BITCOIN ADAPTIVE MOVING AVERAGE
Can the average respond differently to smooth and noisy moves?
Falling, at $82,965. As of Oct 20, 2026.
Bitcoin Adaptive Moving Average
Daily candles
1D candles. Last closed candle: 2026-10-20 00:00:00 UTC.
Drag to zoom, shift and drag to pan. Click the chart before scrolling to zoom with the wheel, and press Escape to let the page scroll again. The candle interval changes the calculation; the range buttons change only the dates on screen.
Adaptive averages alter their response using properties of recent prices. Kaufman’s average compares a net move with the total distance travelled; MESA uses a price-cycle phase estimate. Pick a candle interval and the chart recalculates.
Change the calculation
The last twelve readings as a table
| Candle start, UTC | Adaptive average |
|---|---|
| 2026-08-05 00:00:00 UTC | $63,467.53 |
| 2026-08-13 00:00:00 UTC | $63,588.46 |
| 2026-08-20 00:00:00 UTC | $66,853.38 |
| 2026-08-28 00:00:00 UTC | $78,206.69 |
| 2026-09-04 00:00:00 UTC | $78,285.4 |
| 2026-09-12 00:00:00 UTC | $78,262.46 |
| 2026-09-19 00:00:00 UTC | $77,741.82 |
| 2026-09-27 00:00:00 UTC | $82,772.59 |
| 2026-10-04 00:00:00 UTC | $83,426.86 |
| 2026-10-12 00:00:00 UTC | $83,434.5 |
| 2026-10-19 00:00:00 UTC | $82,965.55 |
| 2026-10-20 00:00:00 UTC | $82,965.47 |
Quote this chart
The image is of the chart as you have it. The link is to the page, which opens on the published reading, so the sentence above is what tells a reader which interval and formula the quotation was taken on.
Maketo. Bitcoin Adaptive Moving Average (kama; period 10, fast 2, slow 30), 1D candles, Maketo combined market. Last closed candle: 2026-10-20 00:00:00 UTC. Calculation version 1.0.0. https://maketo.com/technical-indicators/adaptive-moving-average
Source: <a href="https://maketo.com/technical-indicators/adaptive-moving-average">Maketo Bitcoin Adaptive Moving Average</a>
RIGHT NOW
Falling, at $82,965. As of Oct 20, 2026.
What the day shows
At the 2026-10-20 UTC close, the reading was 82,965.5. The previous available reading was 82,965.6. This price average reacts faster to a clear move and slower to back-and-forth changes. The selected period is 10 daily candles.
How to read that number
A smooth move can make the line respond faster, while repeated reversals can make it smooth more heavily. Compare the two algorithms as distinct methods.
What it was read at
Kaufman adaptive average, fast 2, period 10, slow 30, on daily candles. Change the interval or the settings on the chart above and every number there is recalculated in your browser. This sentence keeps the daily reading the page is published on.
Understanding
Bitcoin Adaptive Moving Average
Where it stands today
Adaptive Moving Average: falling, at $82,965 as of .
What is Bitcoin Adaptive Moving Average?
An adaptive moving average changes how quickly it follows price instead of applying the same response to every candle. The aim is to move more readily when prices make clearer progress and less readily when they repeatedly reverse. It remains a summary of observed prices, with a different way of managing delay.This page contains Kaufman’s adaptive moving average, or KAMA, and the MESA adaptive average, or MAMA. They are separate calculations. Kaufman’s method compares start-to-finish progress with the sum of intervening moves. MAMA estimates changing cycle position in smoothed prices, then adjusts how much each new close contributes to its average.
Measure progress versus backtracking
Imagine walking ten steps forward and ten back: much movement, little progress. KAMA’s efficiency ratio makes that comparison. It divides the absolute change over the window by the sum of absolute candle-to-candle changes. Near 1 describes a direct path; near zero describes more backtracking.
Read KAMA with price
KAMA is a dollar price. Being above it and seeing it rise are separate facts. Maketo’s KAMA reading is Rising when the close is above the line and the line is above its value five candles earlier. The opposite pair produces Falling. A crossing alone can leave the reading Mixed.
Read MAMA with its following line
The MAMA view includes FAMA, a second average which follows it more slowly. Its directional reading compares these two lines instead of using the KAMA price-and-slope rule. The lines can cross while Bitcoin remains below an earlier high: they describe recent response rather than recovery of a particular price.
How Adaptive Moving Average is calculated
Kaufman’s efficiency ratio divides the absolute net change over 10 candles by the sum of absolute candle-to-candle changes. It interpolates between 2- and 30-period smoothing limits. MAMA uses fast and slow phase-response limits. The page is published on Kaufman adaptive average, fast 2, period 10, slow 30. A period counts candles at the interval you choose, so the same setting covers a different stretch of time on a one-hour chart than on a daily one. How smoothing and missing candles are handled.
A calculation you can follow
Consider one illustrative KAMA update after the average has started. Assume the prior adaptive average is $100,000 and the latest close is $109,000. Suppose the window ends $9,000 higher and the sum of absolute price moves is also $9,000. The efficiency ratio is 1.Default fast and slow lengths are 2 and 30. Their response factors are 2 / 3 and 2 / 31. Efficiency 1 selects the faster factor.KAMA squares that factor: (2 / 3)² = 4 / 9. It moves the old average by 4 / 9 of the $9,000 gap.The new average is $100,000 + $4,000 = $104,000. A less direct price path would select a smaller adjustment.Even at maximum efficiency, the line does not jump to the latest close. Adaptive describes a changing response, not the removal of all delay.
KAMA efficiency window
The default period is ten candle-to-candle changes, requiring eleven closes. A longer period changes the history used to judge directness. It does not change the fast and slow limits unless you alter those separately.
KAMA fast and slow lengths
The fast length must be shorter than the slow length. They become response factors before blending and squaring. A fast length of 2 therefore does not make KAMA identical to a conventional two-candle exponential average.
MAMA limits
Defaults are 0.5 for the fast limit and 0.05 for the slow limit. These are response factors, not candle counts. FAMA uses half the current response factor. Maketo displays the first MAMA and FAMA values after a 33-candle run.
Adaptation happens after prices change
A new move affects the average only after its price arrives. Sudden reversals can still leave an adaptive line behind. Smoothness describes the plotted line, not certainty about the next observation.
Starting history affects early values
Both variants repeatedly update earlier calculated values. Early readings depend on the starting convention and available history. A known data gap resets the calculation; missing prices are not silently treated as unchanged prices.
Adaptive Moving Average compared with Weighted Moving Average
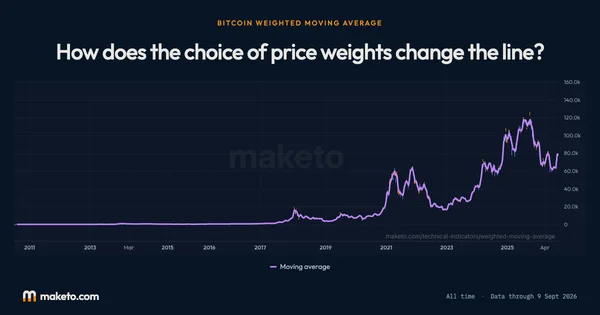
A linear weighted average always applies the same age-based weights for a given period. Adaptive methods change their response according to the observed price path. Hull reduces delay by combining weighted averages, which is a different mechanism again. Open Bitcoin Weighted Moving Average.
Are KAMA and MAMA interchangeable names?
No. KAMA uses a progress-versus-backtracking ratio. MAMA uses a cycle-position calculation and a following line. Grouping them on one page keeps their related purpose together while preserving their different settings.
What happens if every price is unchanged?
Maketo uses an efficiency ratio of 1 when total movement in the window is zero. If the whole available run is constant, the average stays at that price. If only the latest window is flat after an earlier move, an older average can still differ from the close and continue approaching it.
Why does changing interval affect adaptation?
Combining short candles into a longer candle removes the path taken inside that period. This changes measured backtracking or cycle position even when the final closing price is unchanged.
The numbers
behind the chart
What does the current reading show?
Bitcoin price: the latest reading is $82,946, on . The highest reading since is $122,274 on ; the lowest is $0.0495 on .
Adaptive average: the latest reading is $82,965, on . The highest reading since is $121,683 on ; the lowest is $0.0561 on .
Readings since Jul 17, 2010 let you compare Oct 20, 2026 with earlier months. Highest and lowest cover every reading shown; month-end values use the last reading on or before that date. Every figure here is the published daily reading at Kaufman adaptive average, fast 2, period 10, slow 30, beside Bitcoin's own close on the same day. Change the interval or the settings on the chart above and the chart is recalculated in your browser, but this record is not. How Maketo measures the Bitcoin price.
What are the latest, highest and lowest readings?
| Measure | Latest | Highest | Lowest |
|---|---|---|---|
| Bitcoin price | $82,946 | $122,274 | $0.0495 |
| Adaptive average | $82,965 | $121,683 | $0.0561 |
How do the readings compare with earlier dates?
| Reference date | Bitcoin price | Adaptive average |
|---|---|---|
| 1 month ago | $81,235 | $77,742 |
| 3 months ago | $64,989 | $62,684 |
| 6 months ago | $74,815 | $71,992 |
| 1 year ago | $107,197 | $113,973 |
| 2 years ago | $67,617 | $63,908 |
What was the reading at each month’s end?
| Reading date | Bitcoin price | Adaptive average |
|---|---|---|
| $84,462 | $82,773 | |
| $77,842 | $78,207 | |
| $63,901 | $63,591 | |
| $60,164 | $61,552 | |
| $73,771 | $76,370 | |
| $76,327 | $74,978 | |
| $68,250 | $69,369 | |
| $67,627 | $70,500 | |
| $84,192 | $88,474 | |
| $87,568 | $88,548 | |
| $88,279 | $88,937 | |
| $111,658 | $112,324 | |
| $109,008 | $114,212 | |
| $111,780 | $116,089 | |
| $119,452 | $117,429 | |
| $107,077 | $104,340 | |
| $107,797 | $106,185 | |
| $94,264 | $93,842 | |
| $82,385 | $86,649 | |
| $84,330 | $90,519 | |
| $103,740 | $102,086 | |
| $92,710 | $96,785 | |
| $96,425 | $94,339 | |
| $70,262 | $68,021 |
Keep exploring



Source: Calculated by Maketo on one combined spot market, daily candles. Reading for .