

BITCOIN CHOPPINESS INDEX
Has price travelled directly or gone back and forth?
Mixed conditions, at 61.12. As of Oct 20, 2026.
Bitcoin Choppiness Index
Daily candles
1D candles. Last closed candle: 2026-10-20 00:00:00 UTC.
Drag to zoom, shift and drag to pan. Click the chart before scrolling to zoom with the wheel, and press Escape to let the page scroll again. The candle interval changes the calculation; the range buttons change only the dates on screen.
Choppiness compares the path travelled inside the window with the distance between its high and low. A winding path generates a different reading from a more direct one. Pick a candle interval and the chart recalculates.
Change the calculation
The last twelve readings as a table
| Candle start, UTC | Choppiness |
|---|---|
| 2026-08-05 00:00:00 UTC | 62.723 |
| 2026-08-13 00:00:00 UTC | 64.087 |
| 2026-08-20 00:00:00 UTC | 28.067 |
| 2026-08-28 00:00:00 UTC | 29.375 |
| 2026-09-04 00:00:00 UTC | 65.343 |
| 2026-09-12 00:00:00 UTC | 60.328 |
| 2026-09-19 00:00:00 UTC | 54.729 |
| 2026-09-27 00:00:00 UTC | 38.685 |
| 2026-10-04 00:00:00 UTC | 61.187 |
| 2026-10-12 00:00:00 UTC | 54.132 |
| 2026-10-19 00:00:00 UTC | 53.776 |
| 2026-10-20 00:00:00 UTC | 61.117 |
Quote this chart
The image is of the chart as you have it. The link is to the page, which opens on the published reading, so the sentence above is what tells a reader which interval and formula the quotation was taken on.
Maketo. Bitcoin Choppiness Index (choppiness; period 14), 1D candles, Maketo combined market. Last closed candle: 2026-10-20 00:00:00 UTC. Calculation version 1.0.0. https://maketo.com/technical-indicators/choppiness-index
Source: <a href="https://maketo.com/technical-indicators/choppiness-index">Maketo Bitcoin Choppiness Index</a>
RIGHT NOW
Mixed conditions, at 61.12. As of Oct 20, 2026.
What the day shows
At the 2026-10-20 UTC close, the reading was 61.1167. The previous available reading was 53.7755. This compares the total size of daily moves with the distance between the period’s high and low. The selected period is 14 daily candles.
How to read that number
Higher readings describe more back-and-forth movement. Lower readings describe a more direct path, whether price rose or fell.
What it was read at
Choppiness index, period 14, on daily candles. Change the interval or the settings on the chart above and every number there is recalculated in your browser. This sentence keeps the daily reading the page is published on.
Understanding
Bitcoin Choppiness Index
Where it stands today
Choppiness Index: mixed conditions, at 61.12 as of .
What is Bitcoin Choppiness Index?
The Choppiness Index asks how much ground price covered compared with how far apart the highest and lowest prices ended up. Repeated trips through the same range add distance without creating much separation between the extremes. A more direct move usually produces less of that repeated travel. The indicator describes the shape of the path, rather than whether Bitcoin went up or down.Maketo adds the true ranges of the selected candles, divides that total by the highest high minus the lowest low in the same window, then takes a logarithm. The formula is 100 × log10(total true range ÷ window range) ÷ log10(period). True range includes the distance from the preceding close when that distance exceeds the candle’s own high-to-low range. The default period is 14 candles.The result is a score without a price or Bitcoin unit. Dividing two dollar ranges cancels the dollar units. A higher reading means more travel relative to the span of the window; a lower reading means a more direct path. A smooth decline can have the same reading as a smooth rise. That is why this page describes conditions and contributes no upward or downward vote.
High readings describe repeated travel
Maketo labels readings of 61.8 or above Choppy. Price has covered a relatively large total range compared with the window’s overall span. This can happen through repeated reversals or large overlapping candles. It does not establish that the next candle will reverse, or that the present range will continue.
Low readings do not identify the direction
Readings of 38.2 or below receive the label Consistent direction. Check the price chart to see which direction that was. These boundaries are classification conventions, not probabilities or promises. The middle region is labelled Mixed conditions rather than being forced into one of the other descriptions.
A changing reading has two possible causes
The total true range can change, the window’s highest-to-lowest span can change, or both can change together. A large older candle leaving the calculation may move the score even when the latest candle is small. Read the window boundaries before attributing every change to new activity.
How Choppiness Index is calculated
For 14 candles, take log10(sum of true ranges / total high-low range), divide by log10(14), and multiply by 100. The page is published on Choppiness index, period 14. A period counts candles at the interval you choose, so the same setting covers a different stretch of time on a one-hour chart than on a daily one. How smoothing and missing candles are handled.
A calculation you can follow
This four-candle example uses illustrative ranges to make the logarithm easier to inspect. It is separate from the page’s current Bitcoin reading. Suppose the four true ranges add up to $8,000 and the highest high minus the lowest low is $4,000. The range ratio is 8,000 ÷ 4,000 = 2.With a period of 4, the score is 100 × log10(2) ÷ log10(4) = 50. Price covered twice the distance of the window’s span.If repeated moves increase total true range to $12,000 while the span stays $4,000, the score becomes about 79.25.If total true range is only $4,000 for that same $4,000 span, the ratio is 1 and the score is 0. Reversing the direction of the entire price path would not change this calculation.The useful comparison is total travel against the window’s span. The score alone does not tell you whether price rose, how much it rose, or what happens next.
Period and interval
Fourteen hourly candles describe a different path from fourteen daily candles. Increasing the period lets earlier moves and older extremes influence the score for longer. At least one additional preceding close is needed to calculate the first true range, so a 14-candle calculation needs 15 consecutive price candles.
Zero range and unusual values
If every high and low in the window is identical, Maketo returns 100 by convention. The formula is commonly discussed on a 0–100 scale, but Maketo does not clamp it. A large distance from the close just before the window can make total true range unusually large relative to the current window’s span.
Choppy does not mean quiet
Repeated large swings can create a high reading. A narrow, gently drifting market can create a lower one. To measure the size of the swings, use a range measure alongside this description of their path.
The thresholds are not reversal levels
There is no fixed countdown from a reading above 61.8 to a directional move. Similarly, a low score can persist during a continuing rise or decline. The labels summarize completed observations.
Choppiness Index compared with Average True Range
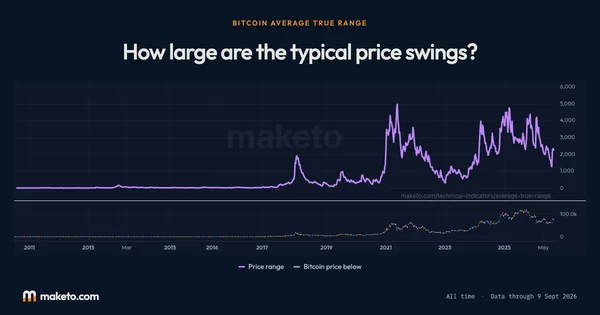
Average True Range measures the size of recent price ranges in dollars or as a percentage of price. The Choppiness Index compares accumulated range with the span of a window. Together they distinguish large repeated swings from a large, more direct move. Open Bitcoin Average True Range.
Can Bitcoin fall while the Choppiness Index is low?
Yes. A steady decline is a consistent path just as a steady rise is. This calculation contains no signed price change and supplies no directional vote.
Why can changing the chart interval change the result so much?
Combining smaller candles hides some of the repeated travel inside them. Fourteen large candles also cover more elapsed time than fourteen small ones. Both the path detail and the measurement window change.
The numbers
behind the chart
What does the current reading show?
Bitcoin price: the latest reading is $82,946, on . The highest reading since is $122,274 on ; the lowest is $0.0495 on .
Choppiness: the latest reading is 61.12, on . The highest reading since is 78.24 on ; the lowest is 6.22 on .
Readings since Jul 17, 2010 let you compare Oct 20, 2026 with earlier months. Highest and lowest cover every reading shown; month-end values use the last reading on or before that date. Every figure here is the published daily reading at Choppiness index, period 14, beside Bitcoin's own close on the same day. Change the interval or the settings on the chart above and the chart is recalculated in your browser, but this record is not. How Maketo measures the Bitcoin price.
What are the latest, highest and lowest readings?
| Measure | Latest | Highest | Lowest |
|---|---|---|---|
| Bitcoin price | $82,946 | $122,274 | $0.0495 |
| Choppiness | 61.12 | 78.24 | 6.22 |
How do the readings compare with earlier dates?
| Reference date | Bitcoin price | Choppiness |
|---|---|---|
| 1 month ago | $81,235 | 54.73 |
| 3 months ago | $64,989 | 51.26 |
| 6 months ago | $74,815 | 44.58 |
| 1 year ago | $107,197 | 42.30 |
| 2 years ago | $67,617 | 41.32 |
What was the reading at each month’s end?
| Reading date | Bitcoin price | Choppiness |
|---|---|---|
| $84,462 | 38.69 | |
| $77,842 | 29.37 | |
| $63,901 | 57.96 | |
| $60,164 | 46.26 | |
| $73,771 | 52.68 | |
| $76,327 | 63.98 | |
| $68,250 | 51.34 | |
| $67,627 | 64.68 | |
| $84,192 | 35.37 | |
| $87,568 | 62.99 | |
| $88,279 | 33.21 | |
| $111,658 | 54.97 | |
| $109,008 | 44.70 | |
| $111,780 | 43.62 | |
| $119,452 | 60.53 | |
| $107,077 | 51.00 | |
| $107,797 | 52.53 | |
| $94,264 | 36.75 | |
| $82,385 | 59.89 | |
| $84,330 | 31.87 | |
| $103,740 | 64.08 | |
| $92,710 | 46.14 | |
| $96,425 | 55.75 | |
| $70,262 | 46.98 |
Keep exploring



Source: Calculated by Maketo on one combined spot market, daily candles. Reading for .