

FUTURES VOLUME
How much futures trading happens in a day
What changed hands in a day, and how that compares with the money left open at the end of it.
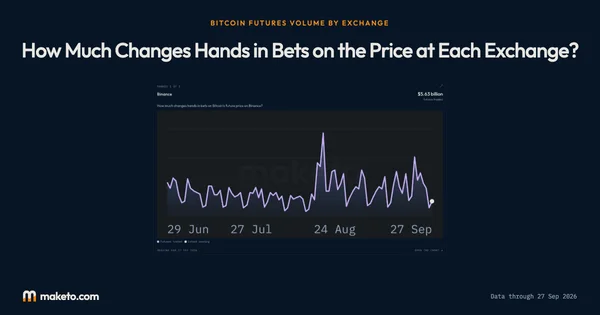
Futures volume across 9 exchanges
Recorded on 3 of the 9 exchanges we cover; the rest publish no reading of this kind.
Right now
0.86 times the open bets, in a day
$22.53 billion changed hands against $26.11 billion left open at the end of the day. A high ratio means positions are being opened and closed quickly; a low one means the money sitting there is mostly staying put. The two figures cover different numbers of exchanges, which the coverage lines under each of them give.
The numbers
behind the chart
What does the current reading show?
Futures volume: the latest reading is $22.53 billion, on . The highest reading since is $65.30 billion on ; the lowest is $3.10 billion on .
A contract here is one exchange's version of the bet. The dollar-settled and the coin-settled versions count separately, so an exchange can carry more than one. Two sets of exchanges are published side by side and never spliced into one line: the widest set the site follows, and the three with the longest record. Joining them would draw a step change on the morning an exchange arrived and label it a market move. These stopped trading or paused, and are no longer counted: BitMEX on 16 Sep 2026, one Bitget contract on 17 Sep 2026 and Coinbase International on 1 Oct 2026.
What are the latest, highest and lowest readings?
| Measure | Latest | Highest | Lowest |
|---|---|---|---|
| Futures volume | $22.53 billion | $65.30 billion | $3.10 billion |
How do the readings compare with earlier dates?
| Reference date | Futures volume |
|---|---|
| 1 month ago | $15.22 billion |
What was the reading at each month’s end?
| Reading date | Futures volume |
|---|---|
| $28.15 billion | |
| $20.73 billion | |
| $22.25 billion |
Understanding
Bitcoin Futures Trading Volume
Where it stands today
$22.53 billion of Bitcoin futures changed hands in a day as of .
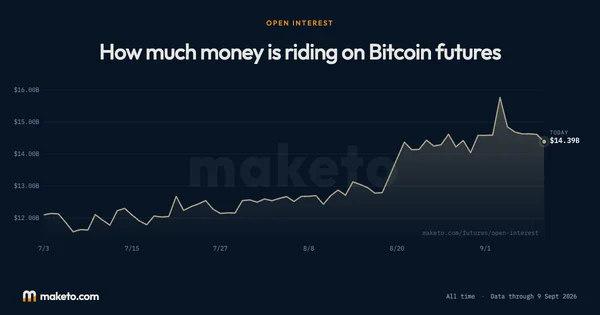
The open bets those trades move are worth $26.11 billion as of .
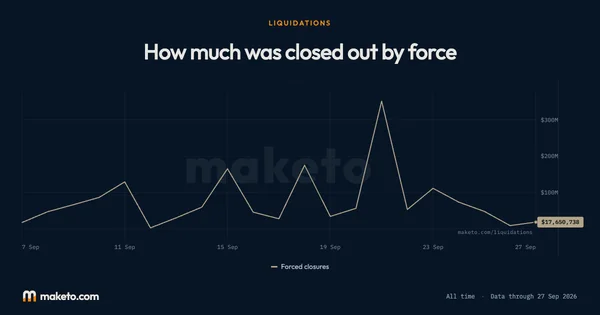
Volume counts what was traded. A single position opened and closed within the day appears twice in volume and leaves nothing behind in open interest, so a busy day is not automatically a day when more money took a side.
Volume against open interest is a rough measure of turnover. A high ratio means positions are being opened and closed quickly; a low one means the money sitting there is mostly staying put.
Two views of the same number run side by side on this page and are never joined into one line. The wider one covers every exchange here and is the more complete picture; it is also the younger, because it only begins on the first day all of them reported. The narrower one is three exchanges with months of history behind it. A single line spliced from both would draw a step upward on the morning the other exchanges arrived and it would look exactly like a market move.
Source: Read from the exchanges' own published contract records, 9 of them, once a day. A contract here is one exchange's version of the bet. The dollar-settled and the coin-settled versions count separately, so an exchange can carry more than one. Reading for .