

DOLLAR YIELDS: TREASURY BILLS, LENDING AND FUTURES
What does a dollar earn?
The U.S. Treasury bill rate, stablecoin lending, a savings rate and what Bitcoin futures pay, each as a yearly rate.
What a dollar earns each year
Every line is a yearly rate in percent. The Treasury bill is its par yield restated with interest on interest, the same footing as the lending and savings rates. Futures funding is a day's payments added up and multiplied by 365, averaged over 30 days, before any cost. The lending line has no readings between 21 Mar 2023 and 25 Oct 2026, and the gap is left as a gap. A line that publishes only on business days, or once a week, is drawn across the days between its readings.
Step through the chart
Yearly rates to 25 Oct 2026
Averaged over 30 days, futures funding was 5.95% a year on 25 Oct 2026, 1.69 points above the 3-month Treasury bill at 4.26% on 23 Oct 2026. On their latest readings, stablecoin lending paid 3.58% and the savings rate 3.80%.
Each figure is a yearly rate in percent, and each row says on which day it was read: the bill is published on business days, lending and savings are read from the lending contracts, and funding is the settled days to yesterday.
Treasury bill, 3 months
4.26% a year, on 23 Oct 2026.
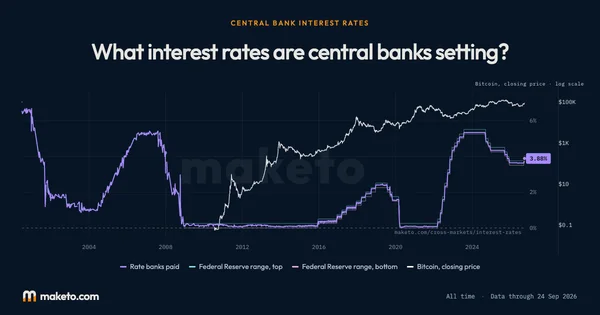
The Treasury published 4.22% as a par yield, which assumes interest is paid twice a year. Counted with interest on interest, the footing the lending and savings rates are on, it is 4.26%. It is the U.S. government's own rate, the base the others are set beside.
Stablecoin lending, USDC
3.58% a year, the middle of 2 lending markets (Aave v3 and Compound v3), on 25 Oct 2026.
Only markets holding at least $25 million count. The same for USDT is 4.37%. Lending carries the risk of the lending contract and of the stablecoin.
Savings rate
3.80% a year, Sky's rate, on 25 Oct 2026.
A rate set by the people who govern the token, not found by a market, so it moves when they decide. The line is Maker's rate before 25 Oct 2026 and Sky's from then on: a change of source, not a market move.
Futures funding, 30-day average
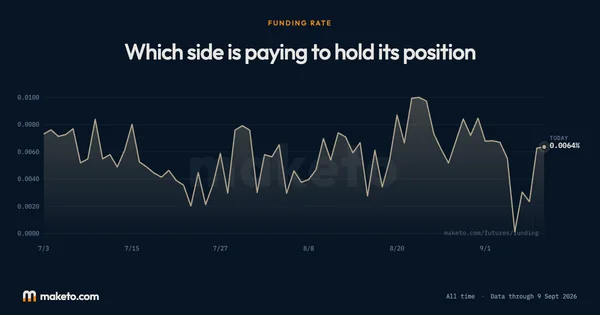
5.95% a year, the average of the 30 days to 25 Oct 2026.
Gross: before fees and before the cost of keeping money at an exchange. Only a position that is hedged, owning the Bitcoin and selling the future against it, collects it, and it falls below zero when the payments run the other way.
Who can collect each rate?
- The bill. Anyone can buy one. It is the U.S. government's rate and the base the others are set beside.
- Stablecoin lending. Anyone can lend the token. It carries the risk of the lending contract, which can fail or be attacked, and of the stablecoin, which can lose its dollar value.
- The savings rate. Anyone holding the token earns it. The people who govern the token set it, and they can change it.
- Futures funding. Only a hedged position collects it: owning Bitcoin and selling the future against it. It is before costs and fees, an exchange holds the money, and the rate can turn negative.
- A description, not advice. A higher rate here is not a better one: each rate comes with its own conditions. Nothing on this page says where any rate goes next.
The numbers
behind the chart
What does the current reading show?
Treasury bill, 3 months: the latest reading is 4.26%, on . The highest reading since is 5.71% on ; the lowest is 0.00% on .
Stablecoin lending, USDC: the latest reading is 3.58%, on . The highest reading since is 16.96% on ; the lowest is 0.11% on .
Savings rate: the latest reading is 3.80%, on . The highest reading since is 8.75% on ; the lowest is 0.00% on .
Futures funding, 30-day average: the latest reading is 5.95%, on . The highest reading since is 92.06% on ; the lowest is −29.49% on .
Daily readings from 15 Nov 2018, the first day the funding record begins. Lines with no reading on a date show their latest reading up to a week back, so a weekend or a week between readings does not leave a cell empty. Each line's highest and lowest are its own, over the days it has a reading, and the lending line's history before its daily record is one reading a week.
What are the latest, highest and lowest readings?
| Measure | Latest | Highest | Lowest |
|---|---|---|---|
| Treasury bill, 3 months | 4.26% | 5.71% | 0.00% |
| Stablecoin lending, USDC | 3.58% | 16.96% | 0.11% |
| Savings rate | 3.80% | 8.75% | 0.00% |
| Futures funding, 30-day average | 5.95% | 92.06% | −29.49% |
How do the readings compare with earlier dates?
| Reference date | Treasury bill, 3 months | Stablecoin lending, USDC | Savings rate | Futures funding, 30-day average |
|---|---|---|---|---|
| 1 month ago | 4.28% | No reading | No reading | 6.66% |
| 3 months ago | 4.00% | No reading | No reading | 6.37% |
| 6 months ago | 3.72% | No reading | No reading | −3.13% |
| 1 year ago | 3.97% | No reading | No reading | 5.82% |
| 2 years ago | 4.79% | No reading | No reading | 7.87% |
What was the reading at each month’s end?
| Reading date | Treasury bill, 3 months | Stablecoin lending, USDC | Savings rate | Futures funding, 30-day average |
|---|---|---|---|---|
| 4.24% | No reading | No reading | 6.30% | |
| 3.95% | No reading | No reading | 7.23% | |
| 3.87% | No reading | No reading | 6.68% | |
| 3.91% | No reading | No reading | 6.33% | |
| 3.72% | No reading | No reading | 1.79% | |
| 3.71% | No reading | No reading | −4.17% | |
| 3.73% | No reading | No reading | −1.09% | |
| 3.70% | No reading | No reading | −0.27% | |
| 3.70% | No reading | No reading | 4.77% | |
| 3.70% | No reading | No reading | 5.85% | |
| 3.92% | No reading | No reading | 6.08% | |
| 3.93% | No reading | No reading | 6.33% | |
| 4.06% | No reading | No reading | 7.37% | |
| 4.27% | No reading | No reading | 8.97% | |
| 4.46% | No reading | No reading | 8.11% | |
| 4.46% | No reading | No reading | 2.27% | |
| 4.41% | No reading | No reading | 4.78% | |
| 4.36% | No reading | No reading | 3.47% | |
| 4.37% | No reading | No reading | 3.81% | |
| 4.37% | No reading | No reading | 7.43% | |
| 4.36% | No reading | No reading | 9.30% | |
| 4.42% | No reading | No reading | 13.07% | |
| 4.63% | No reading | No reading | 15.38% | |
| 4.69% | No reading | No reading | 8.06% |
Understanding
What a Dollar Earns: Treasury Bills, Stablecoin Lending and Futures
Where it stands today
A dollar in a 3-month Treasury bill earns 4.26% a year as of .
A dollar lent in stablecoin lending earns 3.58% a year as of .
A dollar in the savings rate earns 3.80% a year as of .
Futures funding paid 5.95% a year over the last 30 days, before costs as of .
What does each line measure?
Every line is a yearly rate in percent, so a reading of 4% means 4 cents a year for each dollar. The Treasury bill is what the U.S. government pays to borrow for three months. Stablecoin lending is what borrowers pay to use a dollar-linked token such as USDC, shown as the middle of the largest lending markets. The savings rate is the rate Maker, now Sky, sets for holding its dollar token. Futures funding is what traders betting on a rise paid the traders on the other side of Bitcoin's perpetual futures.
Why are the rates put on one footing?
A rate can be quoted several ways, and they do not match. The Treasury publishes a par yield, which assumes interest is paid twice a year. The lending and savings rates already count interest earned on interest. So the bill is restated with interest on interest, the same footing as those two: a par yield of 4.22% is 4.26% a year that way. Funding is not restated. It is a day's payments added up and multiplied by 365, because nobody collects it as interest on interest.
What is futures funding, and who collects it?
A perpetual future never expires. To keep its price close to Bitcoin's, one side pays the other a small fee every eight hours, and that fee is the funding rate. When more traders bet on a rise, they pay, and the rate is above zero. The money moves between traders, not to the exchange. A person who owns Bitcoin and sells a future against it is not exposed to the price, and when the rate is above zero that hedged position is the one that collects the payment. Someone who only holds Bitcoin does not. The line is the average of the last 30 days, before any fees and before the cost of keeping money at the exchange, and it can fall below zero, when the payments run the other way.
What can go wrong with each?
The bill carries the credit of the U.S. government, and the others carry more. Lending a stablecoin means trusting the lending contract, which can fail or be attacked, and the token, which can lose its dollar value. The savings rate is set by the people who govern the token and can be changed. Funding can turn negative, and collecting it means leaving money with an exchange, which can fail. A higher rate on this page is not a better one: it is a rate that comes with more conditions.
Why does the lending line have a gap?
Lending rates are read straight from the lending contracts, and the record has no readings between 21 Mar 2023 and 25 Oct 2026. Before that the rates were read once a week, from 20 Aug 2019. The next reading is on 25 Oct 2026. The chart leaves the gap as a gap and never joins the two ends, because a straight line across it would draw rates nobody recorded.
Why does the chart start in 2018?
It starts on 15 Nov 2018, the first day any of the lines that earn on crypto rails has a reading: the funding record. The Treasury bill goes back to 1990, and its full history is on the interest rates page. It is cut to the same days here so every line covers the same stretch.
Keep exploring
Source: Treasury yields: the U.S. Treasury's daily par yield curve, a public-domain U.S. Government work. Lending and savings rates: read from the lending contracts of Aave, Compound, Maker and Sky on Ethereum. Funding: the public records of the exchanges Maketo covers. Yearly rates, averages and the restatement of the Treasury yield: Maketo's calculations. Reading for .